
Market Analysis
Bitcoin is currently experiencing significant volatility and uncertainty in the market. This updated analysis employs various timeframes and technical indicators to closely examine price direction and potential trends, aiming to provide an informed BTC price forecast through a comprehensive Urdu-language perspective.
Over the long term (examining 365- and 90-day periods), Bitcoin’s market clearly shows an expanding downtrend. Prices have dropped by more than 30%, falling from around 126,200 to 60,000. This downward pressure remains dominant as the market expands, with both RSI and MFI indicators averaging below mid-levels, signaling weak buying momentum. The MACD histogram is slightly positive but fragile, hinting at a possible early reversal without confirming a strong upward trend yet. The 50-day Hull Moving Average (HMA) sits just above the price but slopes downward, indicating a weak uptrend at best. Overall, the long-term outlook remains bearish, though there are some signs of stabilization.
In the medium term (30-day timeframe plus HMA), Bitcoin’s price has declined by approximately 27%, reinforcing the downtrend. The 50-day HMA continues to slope downward, while prices hover near or below this level, reflecting continued selling pressure. RSI and MFI averages hover near 30, further emphasizing bearish market conditions. The MACD histogram presents a mixed picture, but the overall medium-term bias remains tilted toward the downside, suggesting a risk of further price declines.
Short-term analysis (7-day timeframe with RSI and Bollinger Bands) reveals a sharp price drop in the past week, especially on February 23 and 24. The 7-day RSI is near 25, approaching oversold territory, while the MFI also nears 29, potentially signaling a short-term buying opportunity. Prices are close to the lower Bollinger Band, often indicative of a possible rebound. However, declining volume and prevailing uncertainty continue to exert downward pressure. Thus, while the short-term market appears weak, it may be poised for a limited relief rally.
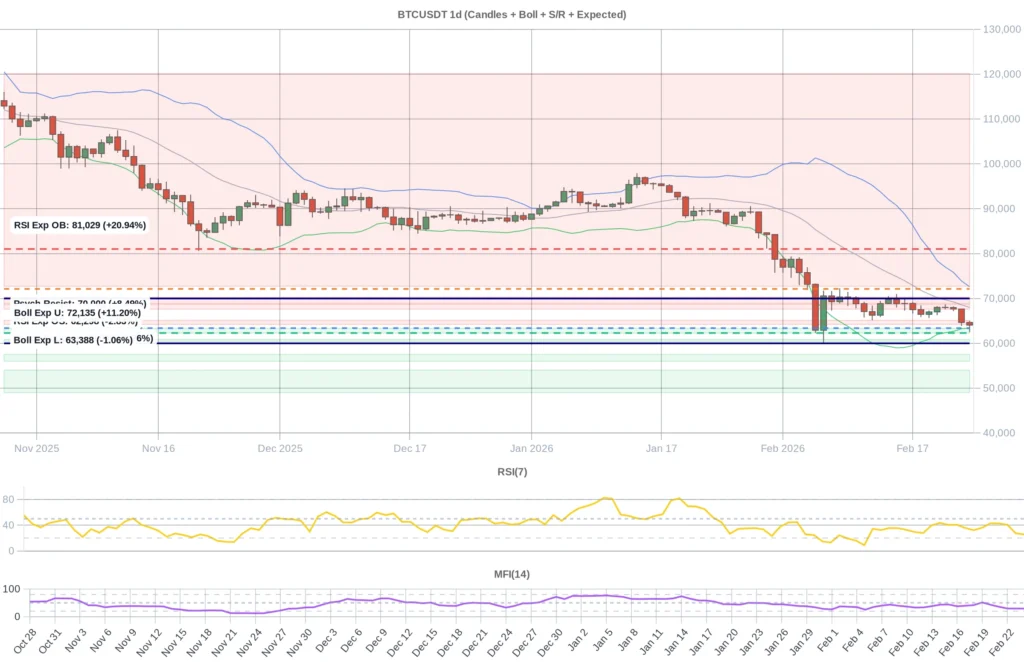
Key support levels are identified between 62,302 and 63,339 (S1), which is close to the current price. If this support breaks, the next zones to watch are 60,459 to 60,864 (S2), followed by further supports at 56,018–57,541 (S3) and 49,000–54,018 (S4). On the resistance side, the nearest range is 64,220 to 65,133 (R1), right above the current price. Beyond that, resistance zones extend through 67,620–68,698 (R2), 68,892–70,288 (R3), and 72,736–120,134 (R4). Breaching R1 could open the path toward R2 and R3, while failing to overcome it may increase selling pressure.
According to prediction models using RSI, Bollinger Bands, and combined CPL daily expected levels, the RSI oversold threshold stands near 62,298, with the overbought level around 81,028. The lower Bollinger Band is expected near 63,387 and the upper near 72,134. The current price hovering around 64,061 is close to the lower Bollinger Band and near the RSI oversold zone, suggesting the short-term potential for a relief rebound. However, due to sustained medium- and long-term bearish pressure, this rebound may be limited in scope. Overall, the alignment of technical levels supports a moderate short-term bounce.
Sentiment indicators paint a mixed picture. The funding rate is slightly negative, close to zero (-0.000002), indicating mild bearish pressure. Open interest has increased by 1.26%, signaling growing market participation. The Fear & Greed Index remains near extreme fear levels (5 to 9), often associated with short-term buying opportunities as larger investors may seize attractive entry points. Recent news highlights intensified market pressure following the sharp price drop below $65,000 and declining liquidity. Macroeconomic challenges and regulatory hurdles continue to exert downward force. Nonetheless, positive developments such as Bitcoin’s increasing acceptance in states like Michigan and Arizona, easing crypto banking conditions from the Federal Reserve, and CME’s 24/7 futures trading contribute institutional support and potential medium- to long-term stability.
In conclusion, Bitcoin’s current market condition reflects a complex balance. The long and medium-term outlook clearly favors a bearish trend, while short-term indicators point toward oversold conditions and the possibility of a relief rally. The price is near critical support levels that, if broken, could trigger further declines; conversely, holding these supports may enable a short-term recovery. Mixed news and sentiment underline ongoing macroeconomic and regulatory challenges, balanced by encouraging legal and institutional backing. Therefore, this analysis suggests cautiously monitoring the market, as moderate short-term gains may emerge, but medium- and long-term downward pressures remain significant. Investors should closely watch key support and resistance levels to better gauge Bitcoin’s directional momentum and adjust strategies accordingly.
Data Summary
- 1. Time:
2026-02-25 – 00:00 UTC - 2. Prices:
Open: 64656.01000000High: 65026.75000000Low: 62510.28000000Close: 64058.15000000
- 8. Supports:
S1: 63339.99000000 – 62302.00000000S2: 60864.99000000 – 60459.90000000S3: 57541.06000000 – 56018.00000000S4: 54018.8 – 49000
- 9. Resistances:
R1: 64220.00000000 – 65133.30000000R2: 67620.01000000 – 68698.70000000R3: 68892.43000000 – 70288.00000000R4: 72736.4 – 120134
- 10. Psychological Support:
60000.00000000
- 11. Psychological Resistance:
70000.00000000
- 3. Last 5 days’ closing prices:
2026-02-20: 68020.010000002026-02-21: 67975.930000002026-02-22: 67643.400000002026-02-23: 64656.020000002026-02-24: 64058.15000000
- 4. Volume:
BTC: 23102.8362USD: $1469512159.7199
- 5. Number of trades:
7553629
- 6. Indicators:
RSI: 25.6100MFI: 29.2600BB Upper: 72623.22000000BB Lower: 63408.53000000
- 7. Moving Averages:
SMA:7=66545.4600000014=67362.7400000021=68015.8700000030=72478.6400000050=80238.77000000100=84737.39000000200=98338.16000000EMA:
7=66296.8000000014=67861.6000000021=69816.3400000030=72329.4000000050=76843.84000000100=84381.75000000200=91631.57000000HMA:
7=64254.9000000014=65961.8700000021=66383.5300000030=65351.5800000050=62004.69000000100=70123.55000000200=73718.22000000 - 12. Funding Rate:
-0.0002% (Technically Positive)
- 13. Open Interest:
79623.1210
- 14. Fear & Greed Index:
8 (Extreme Fear)
Disclaimer: This market analysis is generated by AI based on historical BTC data and sentiment indicators. Use it as a reference, not financial advice.
