
Market Analysis
Bitcoin is currently facing increasing complexity and uncertainty in the market, driven by a combination of technical and fundamental factors. This updated analysis aims to examine the price direction and potential trends through a detailed evaluation, offering a reasoned outlook for Bitcoin’s future price movement.
Over the long term (examining 365-day and 90-day trends), Bitcoin is clearly in an expansion downtrend, reflected in significant price declines and volatility over the past year and quarter. Despite a broad historical range from approximately 126,000 to 60,000 USD, current prices hover near 64,000 USD, close to recent lows. Key indicators such as the Relative Strength Index (RSI) averaging around 49.5 and the Money Flow Index (MFI) near 48.4 suggest weak market momentum, with selling pressure outweighing buying interest. The negative MACD histogram values and downward trends in the Hull Moving Average (HMA) further confirm sustained long-term bearish pressure. While this does not indicate a full-scale bear market, it points to a complex and dynamic downward phase rather than a straightforward decline.
In the medium term, based on the past 30 days and HMA analysis, the market continues to reflect an expansion downtrend. The price drop from roughly 90,600 to 60,000 USD and an RSI average around 31.6 underscore ongoing selling pressure. Although the HMA50 lies below current prices, the stronger bearish signals from HMA100 and HMA200 suggest a weak uptrend or a pronounced downtrend in this timeframe. Positive shifts in the MACD histogram offer some short-term optimism, but the overall bias remains negative. Therefore, medium-term price pressure persists, though there is scope for brief relief rallies.
In the short term, over the past week, the 7-day RSI dipped to 27.5, nearing oversold territory, which could indicate potential buying opportunities. The MFI14 is also low, around 29, signaling weak financial momentum. Price action near the lower band of the Bollinger Bands strengthens the case for a possible short-term reversal. However, fluctuations of the RSI near 40 and MFI oscillating between 29 and 51 suggest short-term price movement remains uncertain and somewhat unstable. Thus, while the short-term trend is unclear, there is a reasonable chance for a modest relief rebound.
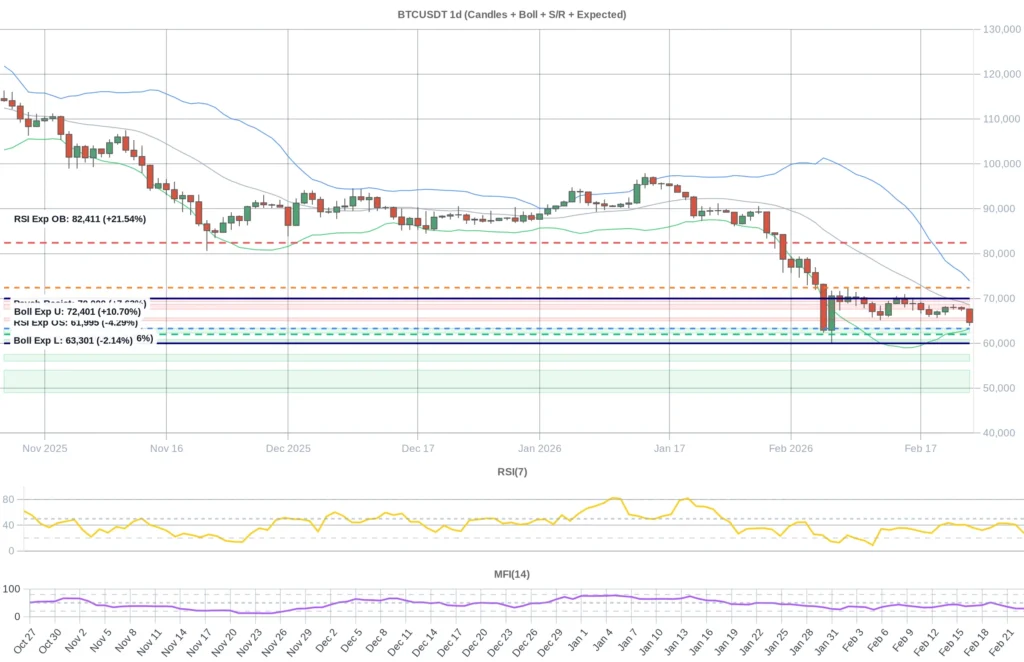
Key support levels are concentrated between approximately 63,300 to 62,300 USD, 60,865 to 60,460 USD, and 57,540 to 56,000 USD. A breakdown below the first support zone would shift focus to subsequent levels, where a rebound may occur. Resistance ranges are noted between 65,040 to 65,660 USD and 67,620 to 68,700 USD, close to recent highs. Surpassing these resistance zones could trigger bullish momentum in both short and medium terms. The current market trend indicates strong support but also formidable resistance challenging upward price movement.
Daily predicted levels based on combined RSI, Bollinger Bands, and other indicators suggest prices near 61,995 USD at oversold conditions and around 82,410 USD when overbought. The lower Bollinger Band is near 63,300 USD, with the upper band around 72,400 USD. Given the current price near 64,700 USD is close to the lower band (within about 2.2%), short-term relief is implied. Considering the overall medium and long-term bearish pressure, this relief is moderate, and a significant bullish recovery will require stronger positive signals.
Market sentiment data shows a stable funding rate around 0.000023, indicating relative equilibrium, but a 2.74% decrease in open interest points to underlying weakness. The Fear & Greed Index remains low, fluctuating between 5 and 9, signaling extreme fear that could present short-term buying opportunities, especially for institutional investors. News flow is mixed: large outflows of $4 billion from major crypto funds and weakness across the tech sector add downward pressure. Political and legal uncertainties, such as cryptocurrency exposures related to the Trump case and Supreme Court rulings, have heightened risk aversion and bearish sentiment. Conversely, significant institutional investments—such as BitMine’s large Ethereum acquisition and Nvidia’s AI cloud commitments—offer some bullish undertones. Overall, sentiment reflects cautious bearishness with pockets of optimism.
In summary, Bitcoin’s current market environment is characterized by a complex, dynamic downtrend, with clear pressures evident in both long and medium terms. Short-term indicators suggest possible relief from oversold conditions, but the broader trend remains bearish. Key support and resistance zones will play a crucial role in shaping near-term price direction. Despite prevailing fear in the market, institutional investments and technological developments provide some positive catalysts for the future. Based on this comprehensive analysis, a cautious approach is advisable, and further technical and fundamental data will be necessary to refine Bitcoin price predictions and guide informed decision-making.
Data Summary
- 1. Time:
2026-02-24 – 00:00 UTC - 2. Prices:
Open: 67643.39000000High: 67684.86000000Low: 63888.79000000Close: 64656.02000000
- 8. Supports:
S1: 63339.99000000 – 62302.00000000S2: 60864.99000000 – 60459.90000000S3: 57541.06000000 – 56018.00000000S4: 54018.8 – 49000
- 9. Resistances:
R1: 65043.99000000 – 65659.78000000R2: 67620.01000000 – 68698.70000000R3: 69290.57000000 – 69914.37000000
- 10. Psychological Support:
60000.00000000
- 11. Psychological Resistance:
70000.00000000
- 3. Last 5 days’ closing prices:
2026-02-19: 67003.730000002026-02-20: 68020.010000002026-02-21: 67975.930000002026-02-22: 67643.400000002026-02-23: 64656.02000000
- 4. Volume:
BTC: 33075.9092USD: $2158158656.1215
- 5. Number of trades:
8268695
- 6. Indicators:
RSI: 27.5500MFI: 29.3700BB Upper: 73907.74000000BB Lower: 63239.44000000
- 7. Moving Averages:
SMA:7=67037.6600000014=67704.3900000021=68573.5900000030=73232.3800000050=80834.80000000100=85039.42000000200=98580.60000000EMA:
7=67043.0200000014=68446.7500000021=70392.1600000030=72899.8300000050=77365.71000000100=84792.33000000200=91908.69000000HMA:
7=66384.2000000014=66808.3800000021=66959.2100000030=65413.9200000050=62297.66000000100=70970.55000000200=74165.87000000 - 12. Funding Rate:
0.0023% (Technically Positive)
- 13. Open Interest:
78625.7050
- 14. Fear & Greed Index:
5 (Extreme Fear)
Disclaimer: This market analysis is generated by AI based on historical BTC data and sentiment indicators. Use it as a reference, not financial advice.
