
Market Analysis
Bitcoin’s current market dynamics are shaped by a variety of complex and evolving factors. This updated analysis offers an in-depth review of price fluctuations and market trends through a comprehensive Urdu-language Bitcoin analysis, aiming to provide clearer insights for more accurate future BTC price predictions.
Over the long term, Bitcoin’s price has declined by approximately 29% compared to the previous year, signaling a pronounced downtrend. Data from the 365-day and 90-day moving averages indicate that the market is in an extended bearish phase. Both the Relative Strength Index (RSI) and Money Flow Index (MFI) averages remain low, reflecting ongoing market weakness. Although the recent positive movement in the MACD histogram suggests the possibility of a short-term correction, the downward slope of the long-term Hull Moving Average (HMA) confirms that selling pressure persists. Consequently, Bitcoin currently occupies a range-bound or transitional phase with limited price stability and heightened volatility.
In the medium term, the trend over the past 30 days reveals a nearly 24% decline, reinforcing the bearish outlook. The 50-day HMA continues its descent and lies below the 100-day and 200-day HMAs, further confirming downward momentum. RSI and MFI values hover near 30, indicating a fragile market. Despite a recent uptick in the MACD histogram pointing to a potential short-term recovery or corrective bounce, the overall medium-term trend remains bearish. Therefore, the medium-term bias is an expanding downtrend, with prices likely to fall further, though some short-term positive movements may occur.
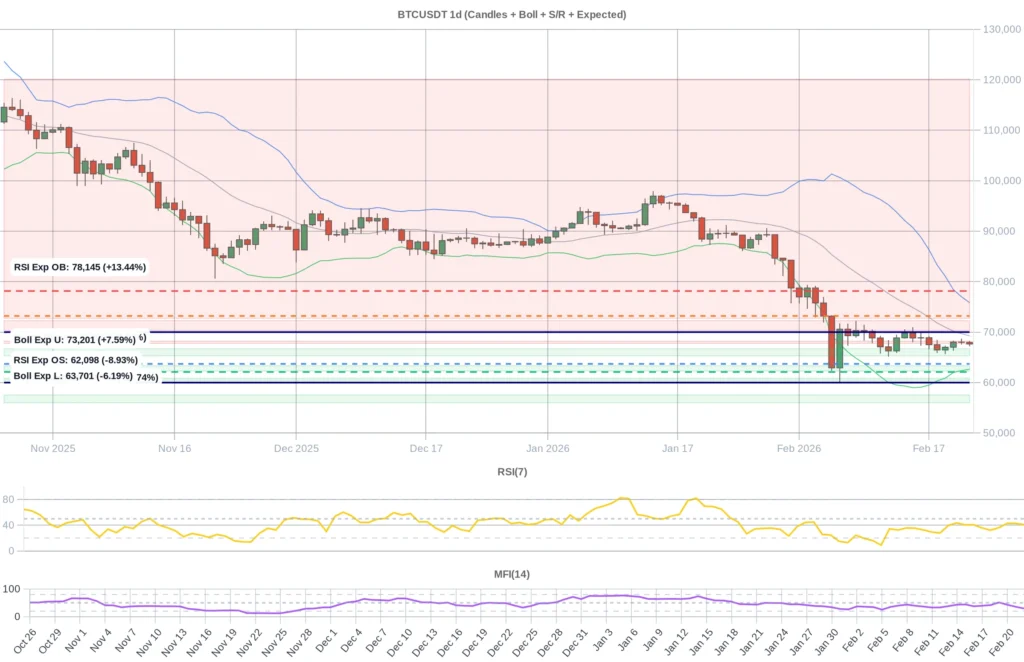
Examining the short term, RSI levels over the past week have ranged between 32 and 42, moving away from oversold conditions yet still signaling weakness. Prices remain close to the middle and lower Bollinger Bands, suggesting subdued but consistent selling pressure. The most recent one-day RSI reading stands at 40.7 with a slight downward tilt, while the midpoint of the Bollinger Bands is near 69,244 and the current price around 67,643—leaning toward the lower band. This implies short-term weakness without extreme bearishness, with prices potentially gravitating toward lower support zones.
Key support levels currently lie between 66,698 and 65,302, 63,339 and 62,302, and 60,864 and 60,459. Should the first support zone fail, the subsequent levels may act as buffers to halt further drops. Resistance ranges are identified between 67,766 and 68,200, 70,330 and 72,271, and 72,736 to 120,134. The psychological resistance near 70,000 is particularly significant, likely presenting a strong barrier. Presently, prices hover close to support levels and remain some distance from resistance, suggesting a short-term bias toward support zones.
According to predictive indicators combining RSI, Bollinger Bands, and double confirmation levels, the oversold threshold is near 62,098 while the overbought mark is around 78,145. The lower Bollinger Band is approximately at 63,701 and the upper band near 73,200. The current price, sitting close to the lower Bollinger Band with about a 6.16% gap, points toward a potential move into oversold territory. However, given the medium and long-term bearish trends, this possibility remains moderate, especially with some signs of short-term correction emerging.
Sentiment indicators provide additional context. The funding rate is marginally positive at 0.00005, indicating limited market pressure. Open interest has increased by 0.8%, suggesting mild buying activity amid prevailing uncertainty. The Fear & Greed Index is near extreme fear levels (8-9), hinting at a possible buying zone in the short term. News flows mostly exert negative influence, including liquidity tightening due to Japanese yen carry unwinding, increased U.S. trade tariffs, and global trade tensions—all contributing to downward pressure on Bitcoin. Additionally, the unlocking of $110 million in tokens following the Chinese Spring Festival could weigh further on prices. Conversely, improved U.S. labor data and lower inflation have supported recent price stability, while rising activity and volume in the DeFi sector, particularly on the Polymarket platform, signal some positive momentum. Whale positions remain balanced, reflecting market caution and hedging strategies. Overall, sentiment blends bearish pressures with limited but notable opportunities for short-term corrective moves.
In conclusion, Bitcoin’s market is navigating a complex and uncertain phase characterized by prevailing medium- and long-term bearish trends alongside some short-term signs of stabilization and correction. Prices are close to critical support zones, and signals from funding rates, open interest, and sentiment indices suggest potential buying opportunities in the near term. However, significant macroeconomic risks and security concerns continue to pressure the market. News developments and balanced whale positioning highlight cautious investor behavior and expectations of volatility ahead. Accordingly, this detailed Bitcoin analysis indicates that the dominant trend remains bearish over the medium term, with limited scope for short-term recovery. Investors are advised to monitor macroeconomic data, token unlock schedules, and security developments carefully to make informed decisions.
Data Summary
- 1. Time:
2026-02-23 – 00:00 UTC - 2. Prices:
Open: 67975.93000000High: 68245.00000000Low: 67190.00000000Close: 67643.40000000
- 8. Supports:
S1: 66698.33000000 – 65302.67000000S2: 63339.99000000 – 62302.00000000S3: 60864.99000000 – 60459.90000000S4: 57541.1 – 56018
- 9. Resistances:
R1: 67766.85000000 – 68200.00000000R2: 70330.38000000 – 72271.41000000R3: 72736.42000000 – 120134.08000000
- 10. Psychological Support:
60000.00000000
- 11. Psychological Resistance:
70000.00000000
- 3. Last 5 days’ closing prices:
2026-02-18: 66461.000000002026-02-19: 67003.730000002026-02-20: 68020.010000002026-02-21: 67975.930000002026-02-22: 67643.40000000
- 4. Volume:
BTC: 8175.1348USD: $553613335.5774
- 5. Number of trades:
2160900
- 6. Indicators:
RSI: 40.7800MFI: 29.5600BB Upper: 75833.01000000BB Lower: 62655.38000000
- 7. Moving Averages:
SMA:7=67642.8600000014=68095.9600000021=69244.1900000030=74051.3600000050=81372.28000000100=85348.82000000200=98823.81000000EMA:
7=67838.6900000014=69029.9400000021=70965.7700000030=73468.3700000050=77884.47000000100=85199.12000000200=92182.59000000HMA:
7=68029.1700000014=67324.7100000021=67195.6400000030=65284.9800000050=62615.57000000100=71807.32000000200=74609.88000000 - 12. Funding Rate:
0.005%
- 13. Open Interest:
80844.2460
- 14. Fear & Greed Index:
9 (Extreme Fear)
Disclaimer: This market analysis is generated by AI based on historical BTC data and sentiment indicators. Use it as a reference, not financial advice.
