
Market Analysis
Recent days have seen Bitcoin’s price movements influenced by a combination of technical and fundamental factors. This analysis aims to provide a comprehensive overview of the current market conditions through a detailed examination of key indicators, offering deeper insights into future price trends for better-informed Bitcoin price predictions.
Over the long term (spanning the past year and 90 days), Bitcoin has clearly been in an expanding downtrend, indicating sustained downward pressure and significant price declines. Within the 365-day window, the price position stands at a low 0.12, reflecting a drop from approximately 126,200 to 60,000. Similarly, the 90-day period shows a consistent downtrend with a 23% decrease in value. The negative slopes of the 100-day and 200-day Hull Moving Averages (HMA100 and HMA200), along with their positioning above current prices, confirm the ongoing long-term bearish pressure. Furthermore, the Relative Strength Index (RSI) and Money Flow Index (MFI) remain in the low-to-mid ranges, signaling weak buying momentum.
In the medium term (around 30 days plus HMA indicators), the downward trend persists, with the price position at 0.26 and a decline exceeding 24%. Although the 50-day HMA remains above the current price, its negative slope suggests a weak uptrend or a lack of a clear reversal. The recent uptick in the MACD histogram hints at some short-term relief, yet the overall medium-term trajectory remains bearish. RSI levels near 31.6 and MFI around 38.7 further reflect subdued buyer interest and ongoing financial strain in the market.
Short-term analysis (7 days plus RSI and Bollinger Bands) reveals price fluctuations over the past week, with the RSI oscillating between 32 and 43—indicative of weakness but not extreme oversold conditions. Prices hover near the middle Bollinger Band, suggesting relative stability under pressure, while their proximity to the lower band may point to a potential bounce or reversal. However, declining volume and weak RSI readings highlight continued market vulnerability. Although the recent rise in the MACD histogram offers a positive signal, this should be viewed only as short-term relief rather than the start of a strong bull run.
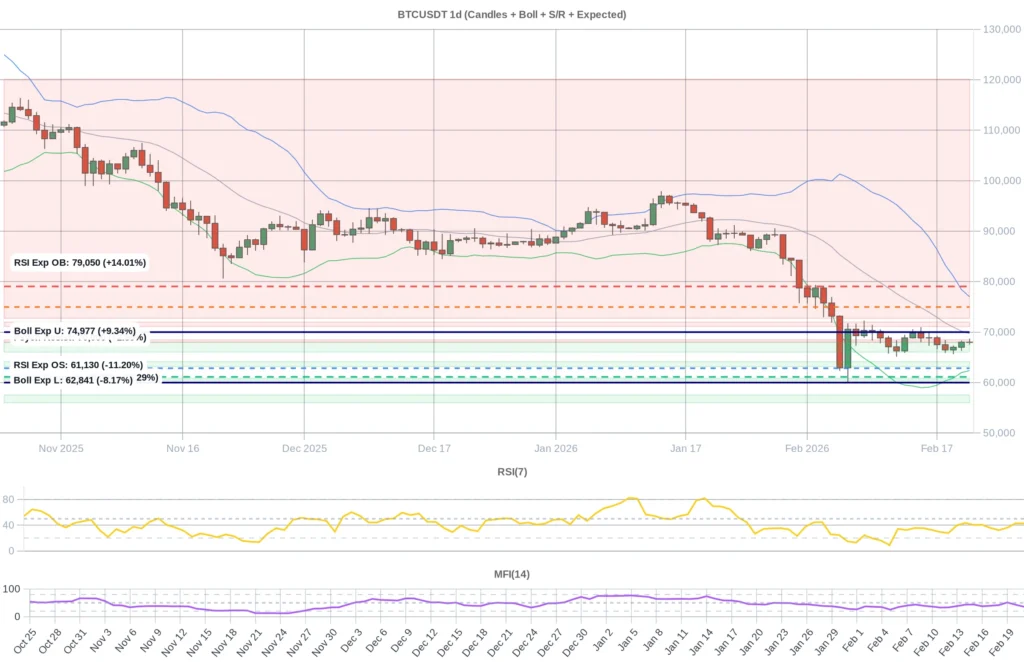
Key support levels currently stand at S1 (around 67,970 to 66,034), S2 (64,144 to 63,178), and S3 (60,865 to 60,460). Should the S1 level break, S2 is expected to act as the next solid support, followed by S3 serving as a crucial lower boundary. On the resistance side, R1 (68,020 to 68,476) and R2 (71,108 to 71,997) are significant hurdles, with a break above R1 potentially triggering short-term upward momentum. The broad range of R3 (72,736 to 120,134) serves as a long-term resistance zone. Psychological price points at 60,000 and 70,000 remain critical support and resistance markers for market participants.
According to daily expected levels from combined RSI, Bollinger Bands, and double indicator models, the oversold threshold lies near 61,130, while the overbought level approaches 79,050. Bollinger Bands set the lower boundary at approximately 62,840 and the upper near 74,976. With current prices around 68,015, close to the lower Bollinger Band but still above oversold territory, there is potential for a moderate bounce. However, given the persistent long- and medium-term bearish pressures, more positive signals are necessary to confirm a sustained bullish reversal.
Sentiment indicators paint a nuanced picture. The funding rate hovers near a neutral yet slightly bullish 0.000032, while open interest has declined by 0.72%, reflecting waning market engagement. The Fear & Greed Index resides in the extreme fear zone (7 to 10), potentially signaling a short-term buying opportunity. On the fundamental front, market sentiment is mixed: liquidity challenges at Blue Owl and U.S. tax policies including a 10% levy along with ETF outflows exert downward pressure. Conversely, the approval of the Clarity Act and record purchases by conviction buyers represent strong long-term bullish factors. Large holders transferring coins to exchanges and heightened liquidation volumes contribute to ongoing market uncertainty. Altogether, the market exhibits both bullish and bearish signals, indicating a transitional phase.
In conclusion, Bitcoin remains under significant downward pressure in both the long and medium terms, although short-term relief rallies are possible. Technical indicators and support zone analyses suggest prices are near a critical support level that could facilitate a bounce. However, a full-fledged bull market requires further positive fundamental and technical developments. The mixed sentiment and complex news environment—characterized by institutional buying but tempered by liquidity crises and large liquidations—advise caution. Investors would be prudent to await clearer signals over the coming days before making decisive moves. Overall, medium-term stability and potential recovery appear likely, though complete long-term reversal will depend on the emergence of more encouraging factors.
Data Summary
- 1. Time:
2026-02-22 – 00:00 UTC - 2. Prices:
Open: 68020.00000000High: 68698.70000000Low: 67534.69000000Close: 67975.93000000
- 8. Supports:
S1: 67969.65000000 – 66034.50000000S2: 64143.56000000 – 63178.32000000S3: 60864.99000000 – 60459.90000000S4: 57541.1 – 56018
- 9. Resistances:
R1: 68020.01000000 – 68476.22000000R2: 71108.00000000 – 71997.02000000R3: 72736.42000000 – 120134.08000000
- 10. Psychological Support:
60000.00000000
- 11. Psychological Resistance:
70000.00000000
- 3. Last 5 days’ closing prices:
2026-02-17: 67503.520000002026-02-18: 66461.000000002026-02-19: 67003.730000002026-02-20: 68020.010000002026-02-21: 67975.93000000
- 4. Volume:
BTC: 8032.8413USD: $547592078.8472
- 5. Number of trades:
1593539
- 6. Indicators:
RSI: 42.7300MFI: 35.7500BB Upper: 77002.57000000BB Lower: 62373.89000000
- 7. Moving Averages:
SMA:7=67812.7400000014=68287.8900000021=69688.2300000030=74783.2500000050=81831.97000000100=85618.33000000200=99064.42000000EMA:
7=67903.7900000014=69243.2500000021=71298.0100000030=73870.0900000050=78302.47000000100=85553.78000000200=92429.21000000HMA:
7=67736.5500000014=67325.3700000021=67040.1300000030=64965.5800000050=62961.22000000100=72633.75000000200=75051.29000000 - 12. Funding Rate:
0.0032% (Technically Positive)
- 13. Open Interest:
80199.6570
- 14. Fear & Greed Index:
8 (Extreme Fear)
Disclaimer: This market analysis is generated by AI based on historical BTC data and sentiment indicators. Use it as a reference, not financial advice.
