
Market Analysis
Recent days have seen significant volatility in the Bitcoin market, capturing the attention of investors worldwide. This analysis explores the current state of Bitcoin using various timeframes and technical indicators, aiming to provide a clearer understanding of price trends, particularly relevant for BTC price predictions in Pakistan.
Over the long term (examining the past 365 and 90 days), Bitcoin's price has experienced a marked decline. Over the last year, the price dropped by nearly 30%, with a further 21.66% decrease observed in the recent 90-day period. Moving averages, notably the 100-day and 200-day Hull Moving Averages (HMA100 and HMA200), are trending downward, indicating sustained bearish momentum. Additionally, average values of the Relative Strength Index (RSI) and Money Flow Index (MFI) remain below moderate levels, highlighting market weakness. This suggests that the long-term outlook is dominated by a strong downward trend, and investors should exercise caution.
Looking at the medium term, specifically the 30-day timeframe, Bitcoin has also declined by approximately 24%. Although prices currently remain above the 50-day Hull Moving Average (HMA50), the downward slope of this average points to a fragile uptrend at best. The MACD histogram is positive and increasing, signaling some buying strength; however, overall, the trend is still under pressure. Therefore, despite some encouraging signs, maintaining a cautious stance over the medium term is advisable.
In the short term, analyzed over a 7-day period using RSI and Bollinger Bands, the RSI7 hovers around 40, reflecting a weak but stable downward trend. The MFI stands near 43, indicating moderate buying activity. Prices are trading within the Bollinger Bands and are close to the lower band, suggesting that while the price is near support, it has not yet entered an oversold condition. This points to some short-term price stabilization, though downward pressure persists.
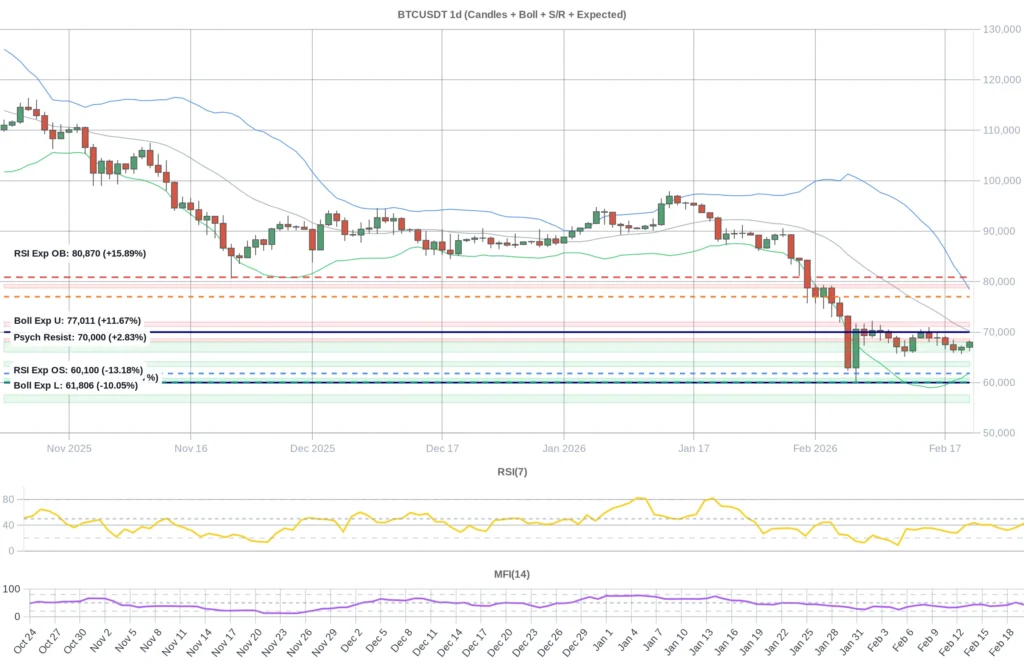
Key support levels are identified between 66,034 and 67,969, near recent lows. Should this range fail to hold, the next support zone lies between 63,178 and 64,143, serving as a critical safety net against further decline. On the resistance side, immediate barriers exist between 68,165 and 68,693, with a stronger resistance zone from 71,108 to 71,997. Breaking through these levels could trigger a positive shift in price momentum.
Daily predictive metrics show the RSI overbought level near 60,099 and the oversold threshold around 80,869. Bollinger Band lower and upper limits are approximately 61,806 and 77,010, respectively. Current prices near 68,020 sit close to the lower Bollinger Band but remain outside oversold territory. This indicates a moderate chance of further downside, though not an extreme oversold state. Consequently, a prudent approach is recommended for both short- and medium-term positions.
Sentiment indicators provide additional context. The funding rate is slightly negative, favoring short positions modestly. Open interest has risen by about 0.75%, demonstrating growing market engagement. The Fear and Greed Index ranges between 7 and 12, signaling extreme fear—often interpreted as a potential buying opportunity. News developments are influencing market emotions as well: Goldman Sachs’ reduction in Bitcoin and Ethereum ETF exposure and warnings from BlackRock are fostering a cautious atmosphere, while Binance’s $1 billion Bitcoin investment and increasing U.S. government Bitcoin reserves are strengthening investor confidence. However, the suspension of a regulatory bill by the U.S. Senate introduces some uncertainty that could impact long-term trends. Overall, market sentiment remains cautious but balanced.
In summary, the current Bitcoin outlook points to a downward trend over the long and medium terms, with some signs of short-term stabilization and potential rebound. Given the technical indicators, support and resistance levels, and mixed sentiment driven by funding rates, open interest, and news, a cautious approach is advisable. For BTC price predictions in Pakistan, this analysis suggests the possibility of short-term improvement, while the longer-term outlook remains under pressure. Investors should consider both technical and fundamental factors carefully to navigate the uncertainties and achieve favorable outcomes. This comprehensive bitcoin analysis aims to offer a deeper insight into the current market dynamics.
Data Summary
- 1. Time:
2026-02-21 – 00:00 UTC - 2. Prices:
Open: 67003.73000000High: 68318.39000000Low: 66280.20000000Close: 68020.01000000
- 8. Supports:
S1: 67969.65000000 – 66034.50000000S2: 64143.56000000 – 63178.32000000S3: 60864.99000000 – 60459.90000000S4: 57541.1 – 56018
- 9. Resistances:
R1: 68165.34000000 – 68693.26000000R2: 71108.00000000 – 71997.02000000R3: 78738.6 – 79424
- 10. Psychological Support:
60000.00000000
- 11. Psychological Resistance:
70000.00000000
- 3. Last 5 days’ closing prices:
2026-02-16: 68892.430000002026-02-17: 67503.520000002026-02-18: 66461.000000002026-02-19: 67003.730000002026-02-20: 68020.01000000
- 4. Volume:
BTC: 35351.8709USD: $2378079150.5678
- 5. Number of trades:
5044912
- 6. Indicators:
RSI: 42.9700MFI: 43.0100BB Upper: 78416.72000000BB Lower: 61985.00000000
- 7. Moving Averages:
SMA:7=68076.6000000014=68381.7100000021=70200.8600000030=75502.7100000050=82272.35000000100=85935.49000000200=99313.74000000EMA:
7=67879.7400000014=69438.2200000021=71630.2100000030=74276.5900000050=78723.97000000100=85908.89000000200=92674.97000000HMA:
7=66818.6900000014=67391.0100000021=66882.9100000030=64658.9100000050=63414.93000000100=73482.03000000200=75501.63000000 - 12. Funding Rate:
-0.0007% (Technically Positive)
- 13. Open Interest:
80783.1750
- 14. Fear & Greed Index:
7 (Extreme Fear)
Disclaimer: This market analysis is generated by AI based on historical BTC data and sentiment indicators. Use it as a reference, not financial advice.
