
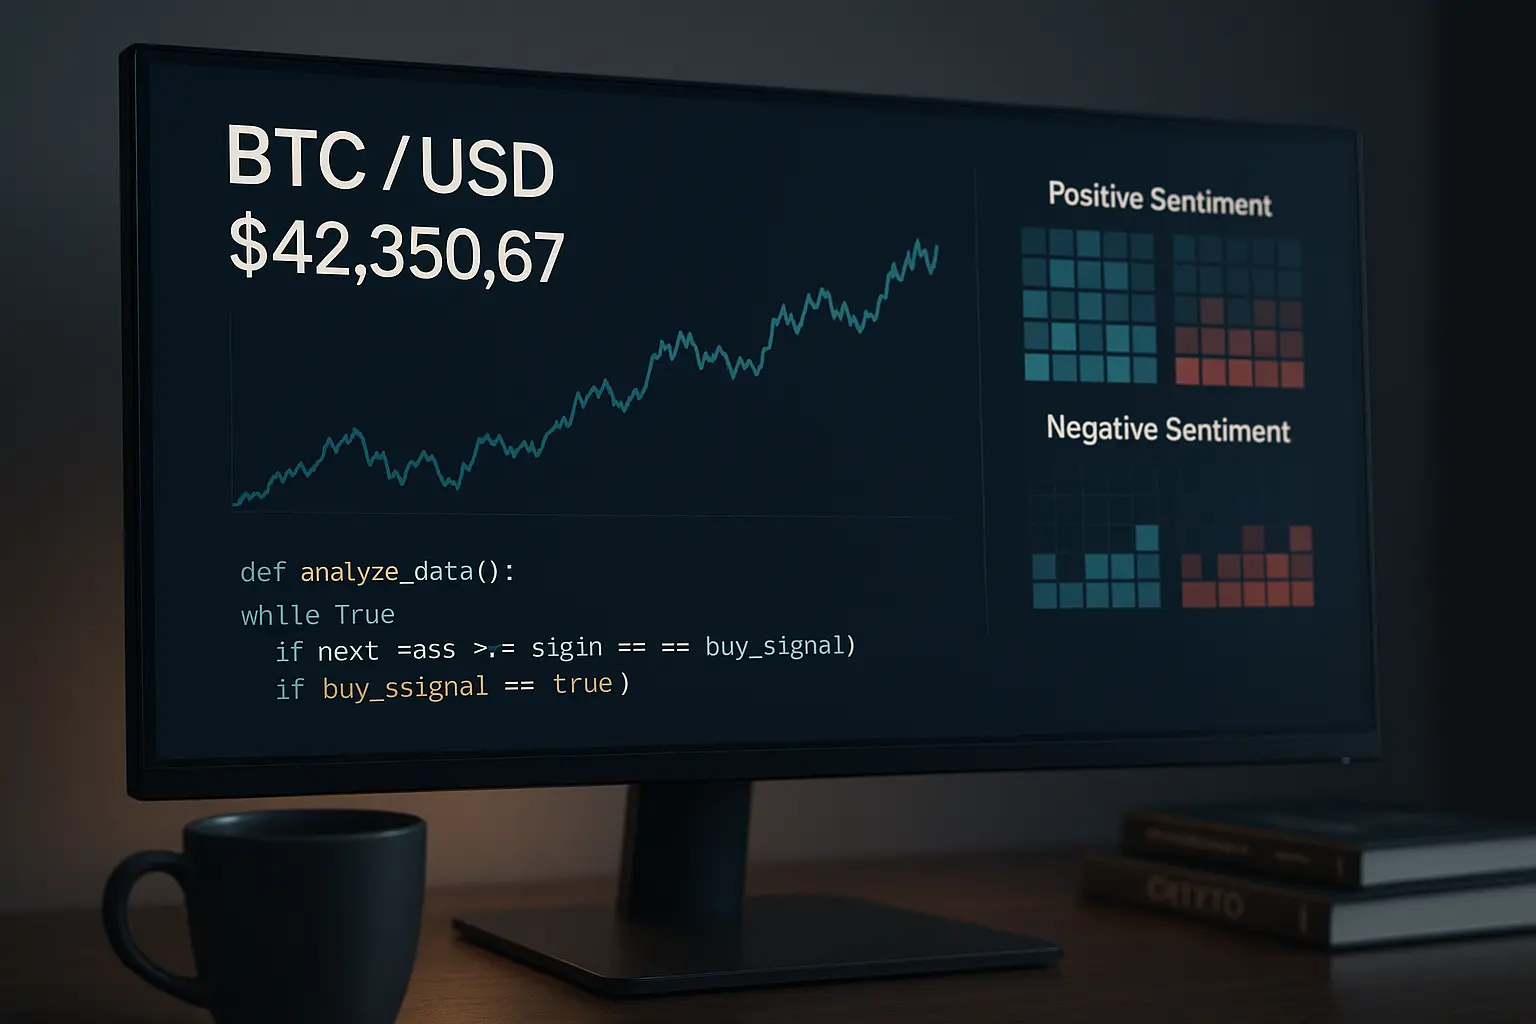
Market Analysis
The cryptocurrency market is currently showing some signs of positive activity; however, the overall trend remains cautious and under pressure. Uncertainty in the global economy continues to weigh on investor sentiment, making it difficult to determine a clear market direction.
Over the past five days, Bitcoin has experienced notable volatility, complicating both technical indicators and market sentiment. Between January 31 and February 4, prices predominantly trended downward, though there were brief periods indicating short-term recoveries. Both the Relative Strength Index (RSI) and Money Flow Index (MFI) remained in oversold territory, signaling market weakness and sustained selling pressure. Specifically, the RSI hovered between 14 and 24, which is indicative of a particularly fragile market. Additionally, Bollinger Bands expanded, highlighting increased uncertainty and volatility within the market.
Examining the Hull Moving Averages (HMA), all key moving averages are trending downward, reflecting ongoing market pressure. The 7-day HMA declined from 80,271 on January 31 to 73,524 by February 4. Similarly, the 14-, 21-, and 30-day moving averages have consistently moved lower. This suggests that both short- and mid-term trends are under stress, with prices closing below these averages—confirming a bearish tendency. Meanwhile, the 50-, 100-, and 200-day moving averages still remain well above current price levels, pointing to sustained weakness over the long term.
Looking at support and resistance levels, prices closed near 73,165, close to the psychological support level of 70,000. Should this support fail, the next support zones lie between 68,507 to 68,010 and further down from 67,969 to 66,034, which may help prevent deeper declines. On the upside, resistance is found between 78,738 and 79,424, close to recent highs. A break above these levels could trigger a temporary recovery in the market. The Fear and Greed Index currently ranges between 14 and 20, indicating extreme fear among investors. While this caution limits buying enthusiasm, it may also present potential opportunities for investment. Trading volume and the number of transactions have remained steady, reflecting ongoing market activity.
News and the broader global economic environment continue to influence Bitcoin’s price. Worldwide economic uncertainty, rising inflation, and international trade tensions have instilled caution among investors. Furthermore, tightening monetary policies and interest rate hikes by central banks have added pressure to the crypto market. Positive news is scarce at the moment, with most headlines highlighting economic challenges, which contributes to the market’s unclear long-term outlook.
The MACD indicator is also signaling mixed messages. Despite slight improvements on some days, the overall trend shows the MACD and signal lines turning downward, confirming bearish sentiment. Prices approaching the lower Bollinger Band suggest the market is oversold, but this does not necessarily imply an immediate reversal. Instead, downward pressure could persist for some time. Under these conditions, investors are advised to exercise caution and avoid making hasty short-term decisions.
Overall, Bitcoin’s current state reflects a complex and cautious market environment. Despite occasional positive movements, prevailing pressure and fear dominate. Prices are closing below moving averages, and technical indicators point toward continued weakness, reinforced by global economic uncertainties and news developments. Investors would be well-advised to wait for clearer signals before making significant moves and to approach their investments cautiously. While short-term reversals are possible, the medium- to long-term outlook remains under bearish pressure.
Data Summary
- 1. Time:
2026-02-05 – 00:00 UTC - 2. Prices:
Open: 75770.21000000High: 76971.52000000Low: 71888.00000000Close: 73165.83000000
- 8. Supports:
S1: 68507.67000000 – 68010.00000000S2: 67969.65000000 – 66034.50000000S3: 60865 – 60459.9
- 9. Resistances:
R1: 78738.61000000 – 79424.00000000R2: 84591.6 – 86129.6
- 10. Psychological Support:
70000.00000000
- 11. Psychological Resistance:
75000.00000000
- 3. Last 5 days’ closing prices:
2026-01-31: 78741.090000002026-02-01: 76968.210000002026-02-02: 78738.610000002026-02-03: 75770.210000002026-02-04: 73165.83000000
- 4. Volume:
BTC: 38375.3600USD: $2852834631.5391
- 5. Number of trades:
10724002
- 6. Indicators:
RSI: 16.0500MFI: 34.4300BB Upper: 99954.48000000BB Lower: 73830.03000000
- 7. Moving Averages:
SMA:7=78899.2300000014=83874.8100000021=86892.2500000030=88559.0400000050=88522.21000000100=91986.15000000200=103328.73000000EMA:
7=78593.5400000014=82345.1700000021=84464.0900000030=86049.0500000050=88216.20000000100=92602.93000000200=96927.08000000HMA:
7=73524.4800000014=74689.2300000021=76781.6700000030=79512.0100000050=84970.24000000100=88110.61000000200=82849.03000000 - 12. Funding Rate:
0.0046%
- 13. Open Interest:
88991.5190
- 14. Fear & Greed Index:
14 (Extreme Fear)
Disclaimer: This market analysis is generated by AI based on historical BTC data and sentiment indicators. Use it as a reference, not financial advice.
