
Market Analysis
The crypto market is showing slight signs of improvement today, but overall sentiment remains uncertain and under pressure. Ongoing complexities in the global economy have heightened investor caution, preventing the market from finding stable footing amid its fluctuations.
Over the past five days, Bitcoin has experienced a notable decline in price, pushing key indicators like the RSI and MFI into oversold territory. On January 30th, Bitcoin opened at 84,650 and closed slightly lower at 84,260. However, by the next day, significant downward pressure drove the price down to 78,741. During this period, the RSI dropped sharply from 24.72 to 14.9, signaling market weakness. On February 1st, the price fell further to close at 76,968, with the RSI reaching a low of 12.97, a clear indication of oversold conditions. Meanwhile, the MFI also declined from 33.85 to 26.33, reflecting reduced liquidity and increasing selling pressure. Fear dominates the market atmosphere, as seen in the Fear & Greed Index remaining between 14 and 16.
Analysis of the Bollinger Bands shows that the price is hovering near the lower band, which typically suggests a possible reversal or at least a short-term stabilization. Still, despite the price touching a low of 75,770 on February 3rd, no significant increase in trading volume has been observed to confirm a reversal. The Hull Moving Averages further reinforce a bearish outlook. The 7-day HMA is down to 75,026 and steadily declining, while the 14-, 21-, 30-, 50-, 100-, and 200-day moving averages are also trending downward, indicating a clear downtrend. Notably, the 50- and 100-day moving averages stand significantly above the current price at 86,446 and 88,638 respectively, underscoring pressure on the long-term trend as well.
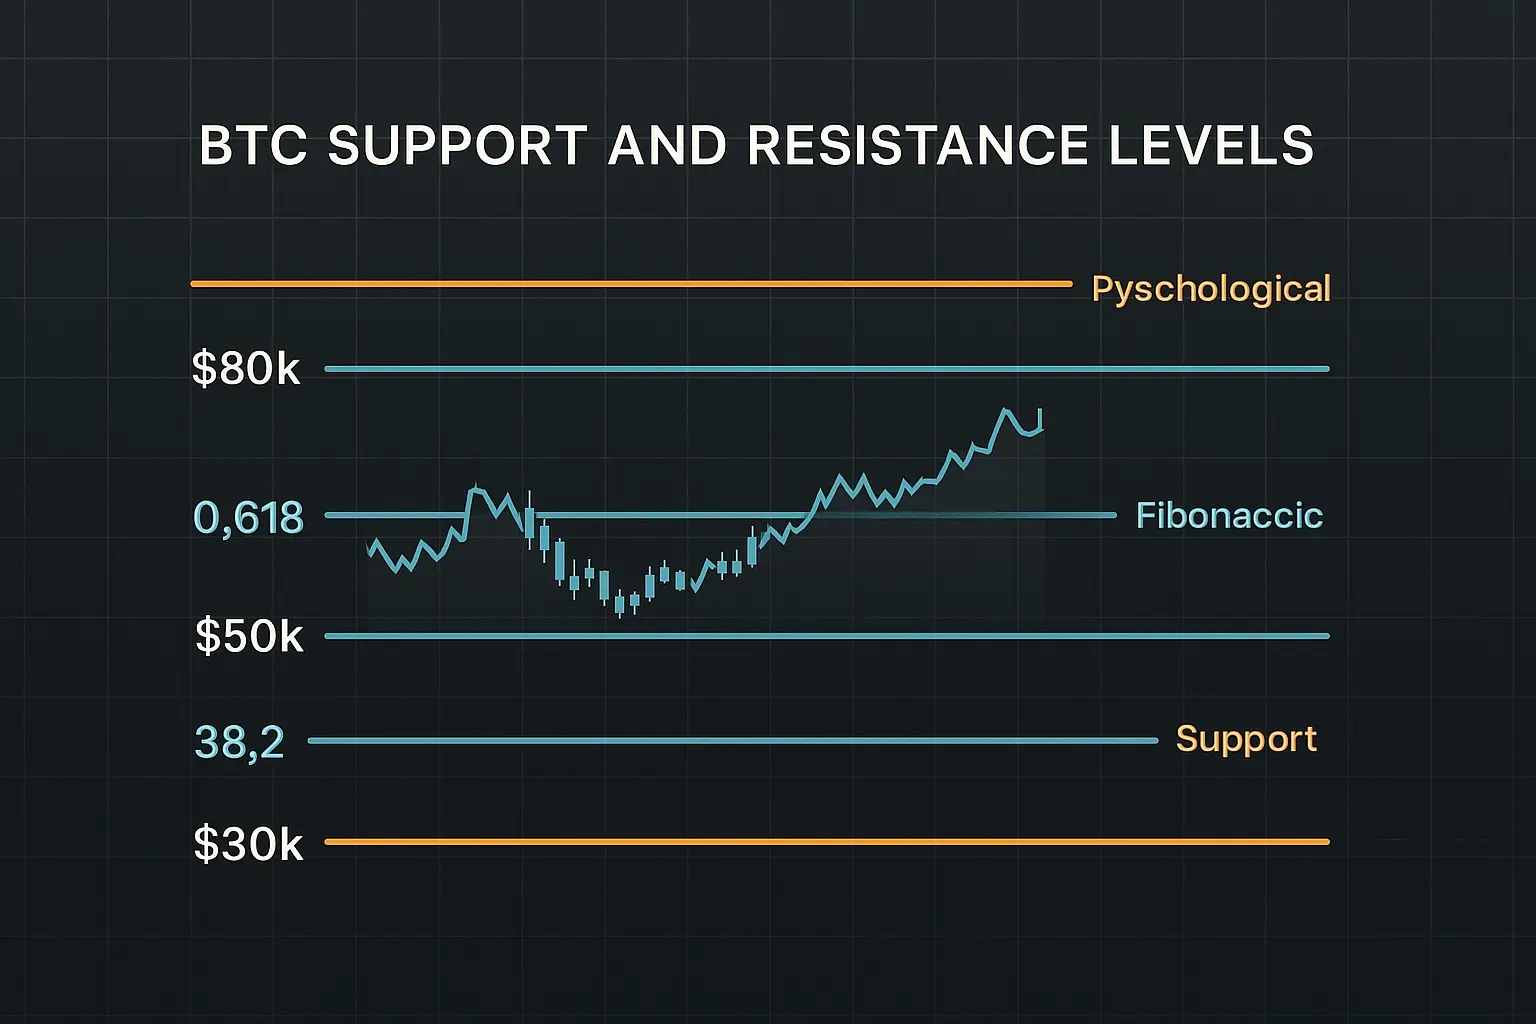
Looking at support levels, Bitcoin is currently near 75,770, close to the psychological support of 75,000. Should this level break, the next support range between 67,969 and 66,034 will become critical, representing a significant test for the market. Resistance lies between 78,738 and 79,424, corresponding to recent highs. A break above this range could spark a temporary recovery, but this would require a noticeable increase in trading volume. At present, the funding rate is negative (-0.000005), and open interest has declined by 0.6958%, suggesting growing pressure from short positions that may push prices lower.
On the news front, persistent global economic uncertainty and shifts in financial policies across various countries are impacting investor sentiment. In particular, the current US administration’s economic strategies and ongoing trade tensions with China have intensified market instability. Additionally, unclear regulatory frameworks regarding cryptocurrencies continue to pose risks for long-term investments. Consequently, investors remain cautious, dampening expectations for any substantial upward momentum in the near term.
In summary, Bitcoin’s price is under significant technical and emotional strain. Key indicators such as the RSI and MFI point towards oversold conditions, while Bollinger Bands and moving averages confirm a bearish trend. If support levels fail, further price declines are likely, although surpassing the 78,738 to 79,424 resistance zone could lead to a temporary rebound. Given the uncertain global economic environment and prevailing negative news, investors should exercise caution and avoid reacting hastily to short-term market volatility.
Data Summary
- 1. Time:
2026-02-04 – 00:00 UTC - 2. Prices:
Open: 78738.60000000High: 79186.81000000Low: 72945.50000000Close: 75770.21000000
- 8. Supports:
S1: 67969.65000000 – 66034.50000000S2: 63340 – 62302
- 9. Resistances:
R1: 78738.61000000 – 79424.00000000R2: 84591.58000000 – 86129.64000000R3: 87232 – 88176
- 10. Psychological Support:
75000.00000000
- 11. Psychological Resistance:
80000.00000000
- 3. Last 5 days’ closing prices:
2026-01-30: 84260.490000002026-01-31: 78741.090000002026-02-01: 76968.210000002026-02-02: 78738.610000002026-02-03: 75770.21000000
- 4. Volume:
BTC: 39120.1089USD: $2986903008.5748
- 5. Number of trades:
9199445
- 6. Indicators:
RSI: 19.4000MFI: 35.7300BB Upper: 100226.41000000BB Lower: 75823.42000000
- 7. Moving Averages:
SMA:7=81204.1100000014=85038.3000000021=88024.9200000030=89248.8300000050=88816.16000000100=92395.57000000200=103558.33000000EMA:
7=80402.7700000014=83757.3800000021=85593.9100000030=86937.5500000050=88830.50000000100=92995.60000000200=97165.89000000HMA:
7=75026.6200000014=76979.9800000021=78868.6200000030=81326.7800000050=86446.99000000100=88638.65000000200=83119.15000000 - 12. Funding Rate:
-0.0005% (Technically Positive)
- 13. Open Interest:
88898.2930
- 14. Fear & Greed Index:
17 (Extreme Fear)
Disclaimer: This market analysis is generated by AI based on historical BTC data and sentiment indicators. Use it as a reference, not financial advice.
