
Market Analysis
The market is showing some signs of positive movement today; however, the overall environment still calls for a cautious approach. Ongoing uncertainties in the global economy, combined with technical indicators from the crypto market, suggest that bearish pressure has not yet fully dissipated.
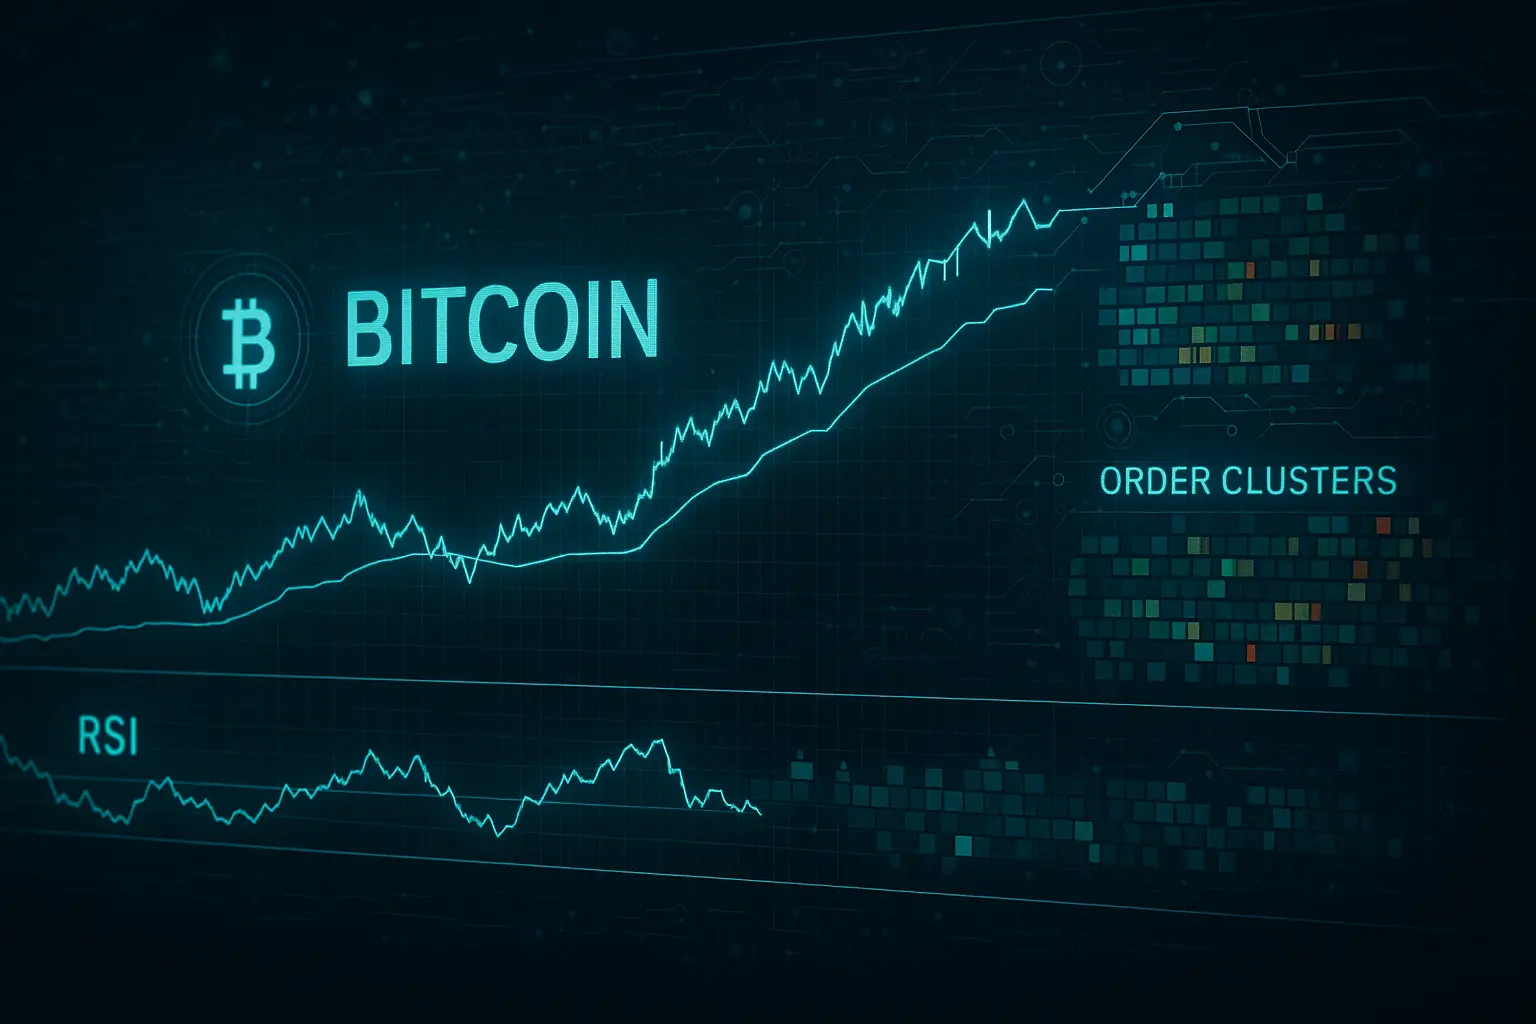
Bitcoin’s price has experienced notable volatility over the past five days. Following a sharp decline on January 20, 2026, the market attempted a mild recovery. On January 19, the price opened at 93,673 and closed at 92,631, reflecting slight weakness. The next day saw a significant drop to 88,427, with key indicators like the RSI at 26.8 and the Fear & Greed Index at 32 signaling heightened fear among investors. Trading volume and the number of transactions also increased on that day, indicating strong selling pressure. In subsequent days, the price showed modest improvement, closing near 89,600 on January 23. Yet, both the RSI and MFI remained below 50, pointing to a weak but somewhat steady trend.
Looking at the Bollinger Bands, Bitcoin touched the lower band on January 20, which is typically an oversold signal, but has since attempted to move back toward the middle band. The bands have widened slightly, reflecting increased market volatility. The price falling below the short-term Hull Moving Averages (HMA7 and HMA14) followed by a slight rebound on January 23 suggests the market is still struggling to establish a clear direction. Longer-term moving averages, such as the 50-day and 100-day, continue to confirm the presence of bearish pressure, especially as the price remains below or close to these levels.
Key support lies between 87,952 and 84,667; a breakdown below this zone could push the price towards the next strong support range of 84,474 to 83,949. On the resistance side, the area between 90,375 and 93,673 is critical, with the psychological level of 90,000 posing a significant hurdle for any meaningful recovery. The low Fear & Greed Index reading and a slight increase in open interest suggest investors remain cautious, limiting the likelihood of a strong short-term rebound. Furthermore, the complexity of the global economic situation and ongoing news developments continue to add pressure, maintaining an atmosphere of uncertainty.
Overall, Bitcoin’s current state reflects a delicate balance. While there are some early signs of positive momentum, bearish forces have not subsided. Both technical signals and market sentiment indicate that investors should proceed with caution. Given the unstable global economic outlook and internal market dynamics, prices could move in either direction. A modest recovery may be possible in the short to medium term, but maintaining a vigilant stance in the longer term remains essential.
Data Summary
- 1. Time:
2026-01-24 – 00:00 UTC - 2. Prices:
Open: 89559.68000000High: 91224.99000000Low: 88578.36000000Close: 89600.26000000
- 8. Supports:
S1: 87952.01000000 – 84667.03000000S2: 84474.69000000 – 83949.52000000S3: 82715.03000000 – 80818.84000000S4: 76322.4 – 76239.9
- 9. Resistances:
R1: 90375.20000000 – 93673.14000000R2: 93859.71000000 – 95228.45000000R3: 96551.01000000 – 97463.95000000R4: 103262 – 104550
- 10. Psychological Support:
80000.00000000
- 11. Psychological Resistance:
90000.00000000
- 3. Last 5 days’ closing prices:
2026-01-19: 92631.000000002026-01-20: 88427.660000002026-01-21: 89454.730000002026-01-22: 89559.670000002026-01-23: 89600.26000000
- 4. Volume:
BTC: 13918.4892USD: $1248772265.6788
- 5. Number of trades:
4619907
- 6. Indicators:
RSI: 35.4200MFI: 49.3400BB Upper: 97045.89000000BB Lower: 87497.08000000
- 7. Moving Averages:
SMA:7=91213.4600000014=92487.8800000021=92271.4800000030=91011.0200000050=90216.07000000100=95217.75000000200=105064.72000000EMA:
7=90808.1000000014=91507.8700000021=91487.0900000030=91381.2800000050=91928.71000000100=95327.47000000200=98735.66000000HMA:
7=88556.8800000014=89141.9300000021=91395.2300000030=93017.4000000050=93790.24000000100=89675.05000000200=84401.65000000 - 12. Funding Rate:
0.007%
- 13. Open Interest:
99638.4580
- 14. Fear & Greed Index:
24 (Extreme Fear)
Disclaimer: This market analysis is generated by AI based on historical BTC data and sentiment indicators. Use it as a reference, not financial advice.
