
Market Analysis
Signs of slight improvement are emerging in the cryptocurrency market today; however, the overall environment remains uncertain and under pressure. Challenges in the global economy, coupled with rising uncertainties, have hindered market sentiment from stabilizing, prompting investors to adopt a cautious stance.
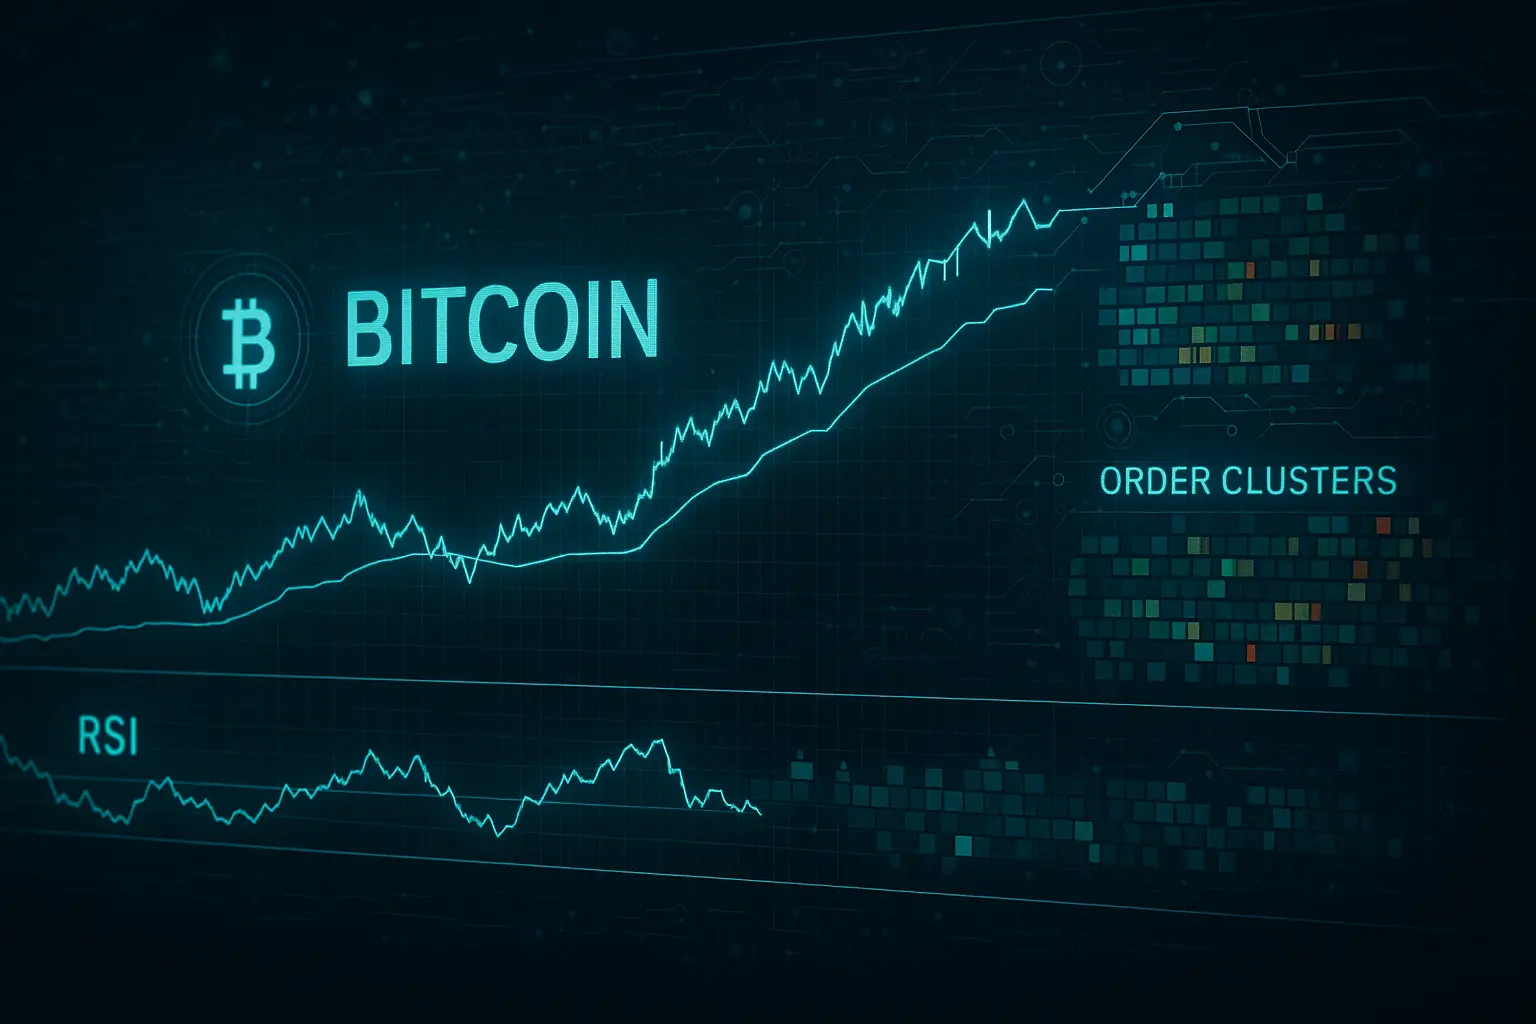
Bitcoin has experienced notable volatility over the past five days, reflecting a fragile and pressured state. Closing at 95,550.94 USDT on January 16, the price gradually declined to 88,427.66 USDT by January 20. The 7-day Relative Strength Index (RSI) dropped significantly from 68.98 to 26.80, clearly signaling market weakness and a bearish trend. Similarly, the 14-day Money Flow Index (MFI) fell from 58.72 to 44.60, indicating reduced liquidity and waning investor enthusiasm. The Fear & Greed Index also declined from 49 to 32, highlighting growing apprehension among market participants.
Looking at the Bollinger Bands, Bitcoin’s price approached the lower band on January 20, suggesting an oversold condition. This may point to a potential short-term reversal or recovery, although confirmation would require additional positive signals. The moving averages, particularly the 7, 14, and 21-day Hull Moving Averages (HMA), continue to trend downward, reinforcing the current bearish pressure. Furthermore, the 50 and 100-day moving averages are turning downward from above, indicating a weakening trend in the medium term.
In terms of support and resistance levels, the zone between 87,952.01 and 84,667.03 USDT (S1) stands out as the first critical support area in the event of further price declines. Should this level be breached, the next support range lies between 84,474.69 and 83,949.52 USDT, followed by a stronger support zone from 78,595.86 to 76,322.42 USDT (S3). On the upside, the resistance range between 88,485.49 and 89,567.75 USDT (R1) is a key hurdle; surpassing it would signal positive momentum for the market. Beyond that, the zone from 92,513.38 to 94,005 USDT (R2) serves as medium-term resistance. Additionally, the psychological resistance at 90,000 USDT remains a critical level that could influence market direction.
Overall, Bitcoin’s current condition reflects a phase of softness and pressure, where bearish sentiment dominates despite some positive movements. Uncertainties in the global economy and subdued investor confidence continue to restrain the market. While the proximity to the lower Bollinger Band hints at a possible short-term rebound, moving averages and other technical indicators still support a bearish outlook. Investors are advised to closely monitor key support and resistance levels and stay attuned to global economic developments to make informed decisions.
Data Summary
- 1. Time:
2026-01-21 – 00:00 UTC - 2. Prices:
Open: 92630.99000000High: 92870.00000000Low: 87895.98000000Close: 88427.66000000
- 8. Supports:
S1: 87952.01000000 – 84667.03000000S2: 84474.69000000 – 83949.52000000S3: 78595.86000000 – 76322.42000000
- 9. Resistances:
R1: 88485.49000000 – 89567.75000000R2: 92513.38000000 – 94005.00000000R3: 96551.01000000 – 97463.95000000R4: 103262 – 104550
- 10. Psychological Support:
80000.00000000
- 11. Psychological Resistance:
90000.00000000
- 3. Last 5 days’ closing prices:
2026-01-16: 95550.940000002026-01-17: 95147.770000002026-01-18: 93673.140000002026-01-19: 92631.000000002026-01-20: 88427.66000000
- 4. Volume:
BTC: 22007.3261USD: $1989676668.5942
- 5. Number of trades:
6064031
- 6. Indicators:
RSI: 26.8000MFI: 44.6000BB Upper: 97247.85000000BB Lower: 87092.05000000
- 7. Moving Averages:
SMA:7=93998.1600000014=92808.6500000021=92169.9500000030=90849.7400000050=90379.49000000100=95921.18000000200=105327.56000000EMA:
7=92529.8300000014=92560.3000000021=92130.6500000030=91788.7900000050=92233.28000000100=95685.41000000200=99015.75000000HMA:
7=89849.8300000014=93933.6900000021=94853.8600000030=94954.1500000050=94042.57000000100=89018.72000000200=84531.54000000 - 12. Funding Rate:
0.0057%
- 13. Open Interest:
94014.5150
- 14. Fear & Greed Index:
32 (Fear)
Disclaimer: This market analysis is generated by AI based on historical BTC data and sentiment indicators. Use it as a reference, not financial advice.
