
Market Analysis
The market is showing some positive signs today; however, the overall environment still calls for caution. Challenges in the global economy have undermined investor confidence, making it difficult to identify a clear direction for the cryptocurrency market at this time.
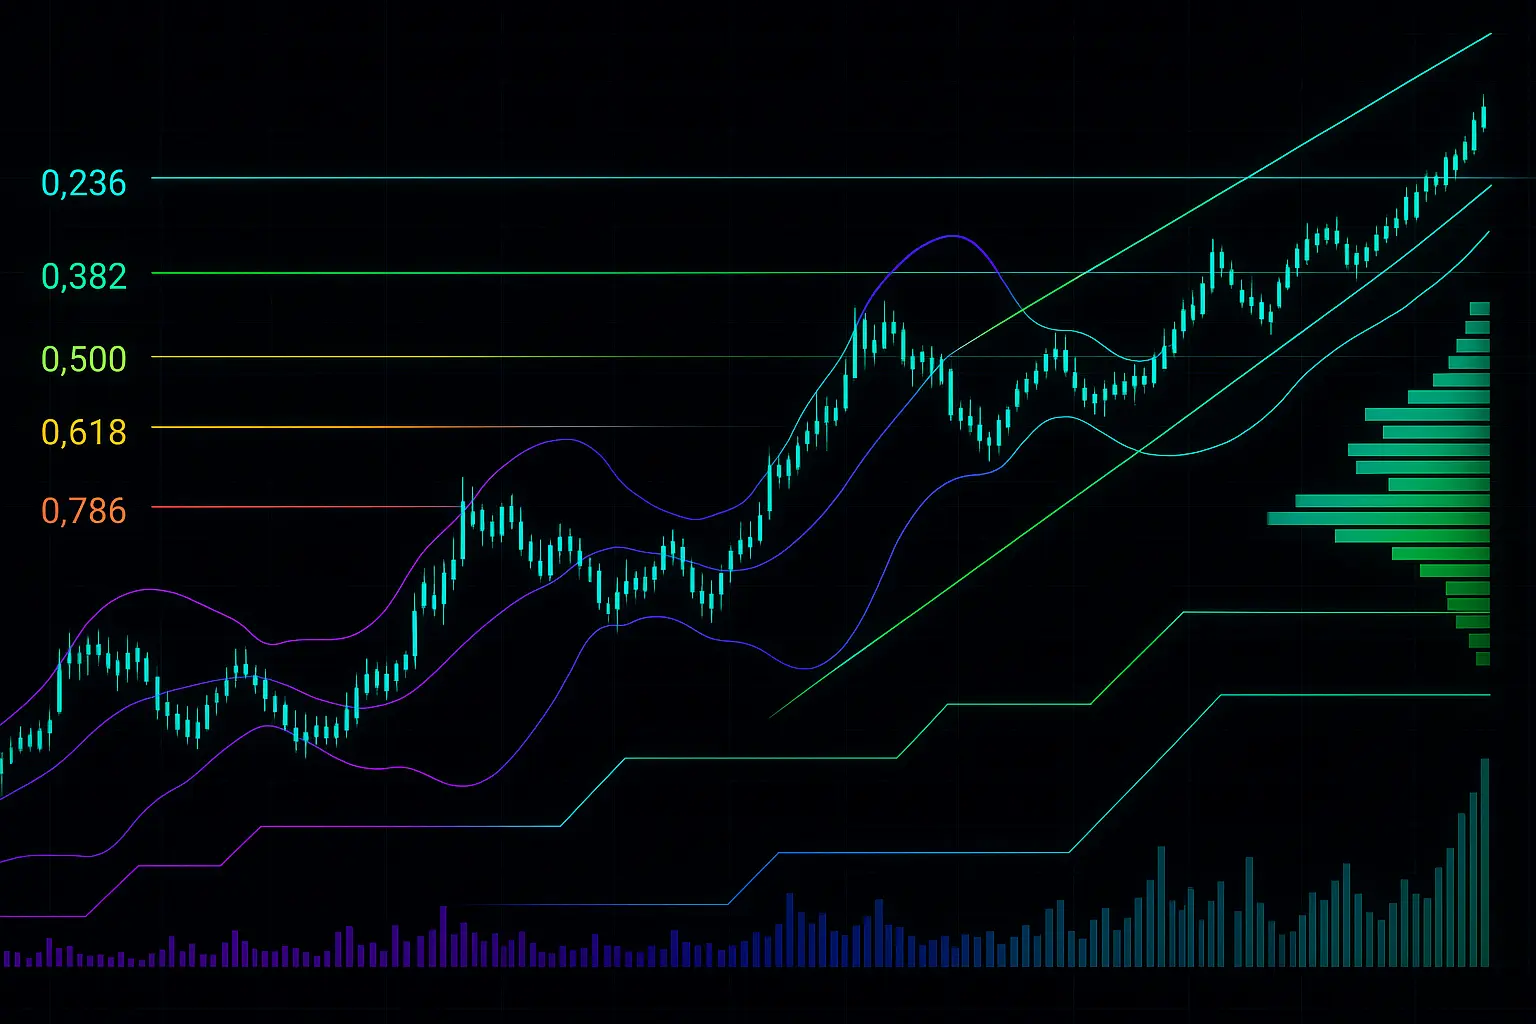
Over the past five days, Bitcoin’s price has experienced notable fluctuations. On January 13, 2026, it opened at 91,296 and closed higher at 95,414, followed by temporary gains on January 14 and 15. The 7-day RSI indicator rose from 78.2 on the 13th to 82.07 on the 14th, nearing the overbought threshold, but then declined to 64.94 in the subsequent days, signaling moderate yet weakening buying momentum. Similarly, the 14-day MFI climbed from 65.87 to 73.7 before dropping to 58.23, reflecting a decrease in financial inflows. The Fear & Greed Index rose from 26 to 50, indicating a shift from fear to more neutral sentiment, although full investor confidence remains absent.
Looking at the Bollinger Bands, Bitcoin’s price mostly stayed above the middle band at 91,643, approaching the upper band near 97,313 before retreating. This suggests some selling pressure and indicates that prices are unable to sustain levels in the overbought zone for long. According to moving averages (HMA), the 7-day HMA stands at 95,948, slightly below the 14-day HMA of 96,214, with the 14-day and 21-day HMAs close to each other. This points to some weakening in the short-term trend. Overall, the technical signals indicate a neutral to mildly bearish phase, where prices fluctuate without establishing a clear trend.
In terms of support and resistance, Bitcoin closed at 95,147, near the S1 support range of 94,881 to 92,206. If this support level breaks, the next significant support lies between 90,504 and 90,056. On the upside, resistance is expected in the R1 range of 96,551 to 97,463, near recent highs, and if surpassed, the next target would be between 101,109 and 101,732. Psychological levels at 90,000 (support) and 100,000 (resistance) also play a crucial role, especially in this climate of uncertainty.
From a broader perspective, ongoing global economic challenges and geopolitical tensions have heightened investor hesitancy. Strained relations between the U.S. and China, coupled with economic slowdown in the European Union, continue to weigh on the crypto market. Additionally, potential regulatory tightening around Bitcoin mining and new financial rules are impacting market sentiment, prompting investors to adopt a more cautious stance.
The decline in financing rates and open interest further indicates shrinking liquidity and reduced trader positions, contributing to short-term price uncertainty. While the recent rise in the Fear & Greed Index is a positive development, its moderate level reflects the lack of robust market confidence.
In summary, Bitcoin is currently in a neutral to slightly bearish phase. Despite some short-term gains, no strong upward trend has formed. Technical indicators and moving averages suggest that if key support levels fail, further price declines are likely, although breaking resistance could lead to temporary improvements. Given the ongoing global economic uncertainties and evolving financial policies, investors should remain vigilant and closely monitor market movements in the near term.
Data Summary
- 1. Time:
2026-01-18 – 00:00 UTC - 2. Prices:
Open: 95550.94000000High: 95639.45000000Low: 95021.67000000Close: 95147.77000000
- 8. Supports:
S1: 94881.47000000 – 92206.02000000S2: 90504.70000000 – 90056.17000000S3: 87952.01000000 – 84667.03000000S4: 78595.9 – 76322.4
- 9. Resistances:
R1: 96551.01000000 – 97463.95000000R2: 101109.59000000 – 101732.31000000R3: 103261.60000000 – 104550.33000000R4: 108816 – 109450
- 10. Psychological Support:
90000.00000000
- 11. Psychological Resistance:
100000.00000000
- 3. Last 5 days’ closing prices:
2026-01-13: 95414.000000002026-01-14: 96951.780000002026-01-15: 95604.800000002026-01-16: 95550.940000002026-01-17: 95147.77000000
- 4. Volume:
BTC: 4280.8014USD: $408161941.6719
- 5. Number of trades:
1020527
- 6. Indicators:
RSI: 64.9400MFI: 58.2300BB Upper: 97313.19000000BB Lower: 85973.70000000
- 7. Moving Averages:
SMA:7=94425.5900000014=93123.3300000021=91643.4500000030=90530.5700000050=90233.83000000100=96557.64000000200=105560.36000000EMA:
7=94534.6900000014=93223.0100000021=92369.4300000030=91861.6200000050=92325.89000000100=95941.62000000200=99242.82000000HMA:
7=95948.8900000014=96214.8500000021=95322.8700000030=94906.6500000050=92934.57000000100=87889.53000000200=84630.09000000 - 12. Funding Rate:
0.003% (Technically Positive)
- 13. Open Interest:
95255.8780
- 14. Fear & Greed Index:
50 (Neutral)
Disclaimer: This market analysis is generated by AI based on historical BTC data and sentiment indicators. Use it as a reference, not financial advice.
