
Market Analysis
The cryptocurrency market is showing some signs of positive activity today, yet the overall trend remains cautious and uncertain. The fragility of the global economy and rising uncertainties continue to heavily influence investor behavior, playing a crucial role in shaping the market’s direction.
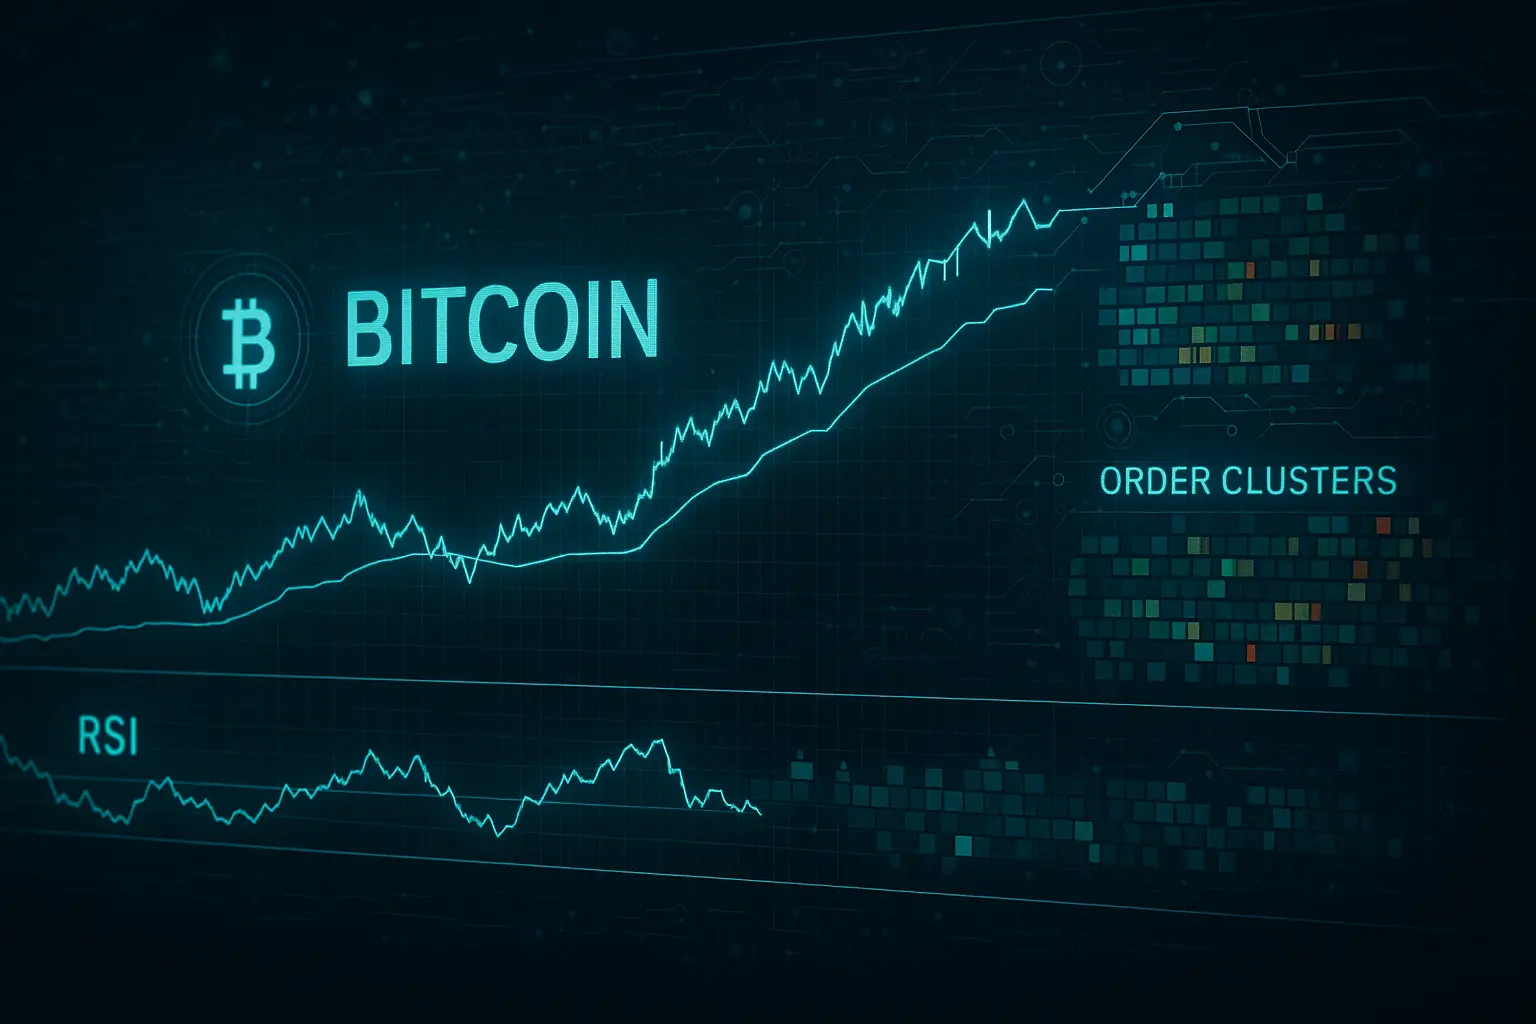
Bitcoin’s price has experienced notable volatility over the past five days, with periods of significant upward momentum, though the market has not fully committed to a clear bullish or bearish trend. On January 10, Bitcoin opened at 90,641 and closed slightly lower at 90,504, indicating a neutral stance. The Relative Strength Index (RSI) stood at 49.36, while the Money Flow Index (MFI) was at 64.09, suggesting moderate buying interest that lacks strong conviction. On January 11 and 12, prices inched up slightly, with the RSI rising from 54.16 to 56.8, hinting at gradual improvement despite lingering market weakness. However, on January 13 and 14, Bitcoin saw a sharp price surge, pushing the RSI from 78.2 to 82.07—entering an overbought zone that signals the possibility of a short-term correction or retracement. Meanwhile, the MFI climbed from 65 to 73.7, reflecting increased capital inflows.
Analyzing Bollinger Bands reveals that on January 14, Bitcoin’s price approached the upper band, which typically indicates a strong upward trend. At the same time, a contraction in price range was observed, often a precursor to a significant upcoming move. The Hull Moving Averages (HMA) further support this bullish momentum, especially with the 7-day and 14-day averages rising sharply above the price in recent days, suggesting a strengthening short-term uptrend. The 21-day and 30-day moving averages remain below the current price but also show positive shifts, indicating some mid-term improvement.
In terms of support levels, the closest range lies between 90,056 and 96,945, offering a solid buffer near the current price point. Should this zone break down, the next major support falls between 84,667 and 87,952, which could become critical if the market faces further downward pressure. On the resistance side, the first level is identified between 97,185 and 98,270. A successful breakout here could test the psychological milestone of 100,000. Beyond that, resistance zones extend from 101,109 to 101,732 and from 104,103 to 105,500, posing potential challenges to upward movement. The Fear & Greed Index currently stands at a moderate 48, indicating a market neither dominated by panic nor excessive greed.
Slight increases in the financing rate and open interest point to a modest rise in market engagement, though not strong enough to confirm a sustained long-term uptrend. Recent developments reflect ongoing global economic uncertainties and mounting political and financial pressures. In particular, tensions between the U.S. and China, along with economic struggles within the European Union, have amplified market unease, which may weigh negatively on cryptocurrency prices.
Overall, Bitcoin’s current status presents a complex and balanced picture. While short-term gains have been notable, overbought indicators and global economic headwinds advise caution. Positive signals from moving averages and Bollinger Bands are tempered by the narrow range between support and resistance levels and the moderate reading on the Fear & Greed Index, all of which suggest the potential for sudden market shifts. Investors are advised to maintain balanced positions and closely monitor global economic developments to respond swiftly to any unexpected changes.
Data Summary
- 1. Time:
2026-01-15 – 00:00 UTC - 2. Prices:
Open: 95413.99000000High: 97924.49000000Low: 94559.28000000Close: 96951.78000000
- 8. Supports:
S1: 96945.63000000 – 90056.17000000S2: 87952.01000000 – 84667.03000000S3: 82715 – 80818.8
- 9. Resistances:
R1: 97185.18000000 – 98270.00000000R2: 101109.59000000 – 101732.31000000R3: 104103.72000000 – 105500.00000000R4: 111696 – 112371
- 10. Psychological Support:
90000.00000000
- 11. Psychological Resistance:
100000.00000000
- 3. Last 5 days’ closing prices:
2026-01-10: 90504.700000002026-01-11: 91013.650000002026-01-12: 91296.200000002026-01-13: 95414.000000002026-01-14: 96951.78000000
- 4. Volume:
BTC: 22851.8943USD: $2201535821.6486
- 5. Number of trades:
5346212
- 6. Indicators:
RSI: 82.0700MFI: 73.7000BB Upper: 95861.89000000BB Lower: 85155.32000000
- 7. Moving Averages:
SMA:7=92417.3700000014=91920.3800000021=90508.6100000030=89641.2200000050=89961.93000000100=97357.62000000200=105722.63000000EMA:
7=93363.0000000014=92049.0900000021=91359.7400000030=91072.5200000050=91930.27000000100=95973.17000000200=99358.85000000HMA:
7=96564.9900000014=93048.5900000021=93221.5200000030=93089.7400000050=91252.81000000100=86647.54000000200=84831.57000000 - 12. Funding Rate:
0.0041%
- 13. Open Interest:
95153.4400
- 14. Fear & Greed Index:
48 (Neutral)
Disclaimer: This market analysis is generated by AI based on historical BTC data and sentiment indicators. Use it as a reference, not financial advice.
