
Market Analysis
The current market outlook shows some encouraging signs, though the overall trend remains cautious and somewhat fragile. Uncertainty in the global economy has heightened investor prudence, delaying any clear and sustained recovery in cryptocurrency prices.
Over the past five days, Bitcoin’s price has experienced significant fluctuations, leading to mixed market sentiment. On January 3rd, Bitcoin opened around 89,995 USD and closed at 91,364 USD on January 7th, encountering several peaks and valleys throughout this period. The Relative Strength Index (RSI) indicated an overbought condition early in the week, especially on January 5th and 6th when the RSI exceeded 80, signaling short-term heavy buying pressure. However, by January 7th, the RSI dropped to 56.57, suggesting some market correction or weakening momentum. Similarly, the Money Flow Index (MFI) mostly stayed above 70, reflecting consistent capital inflow, but showed a slight decline to 71.51 on January 7th.
Looking at the Bollinger Bands, the price approached the upper band on January 5th, signaling a strong upward trend. Yet, by January 7th, the price retreated toward the middle band, indicating growing uncertainty in market direction. Trading volume and activity spiked on January 5th and 6th, pointing to increased market engagement and potential bullish momentum, but a decline in volume on January 7th hinted at weakening buying power.
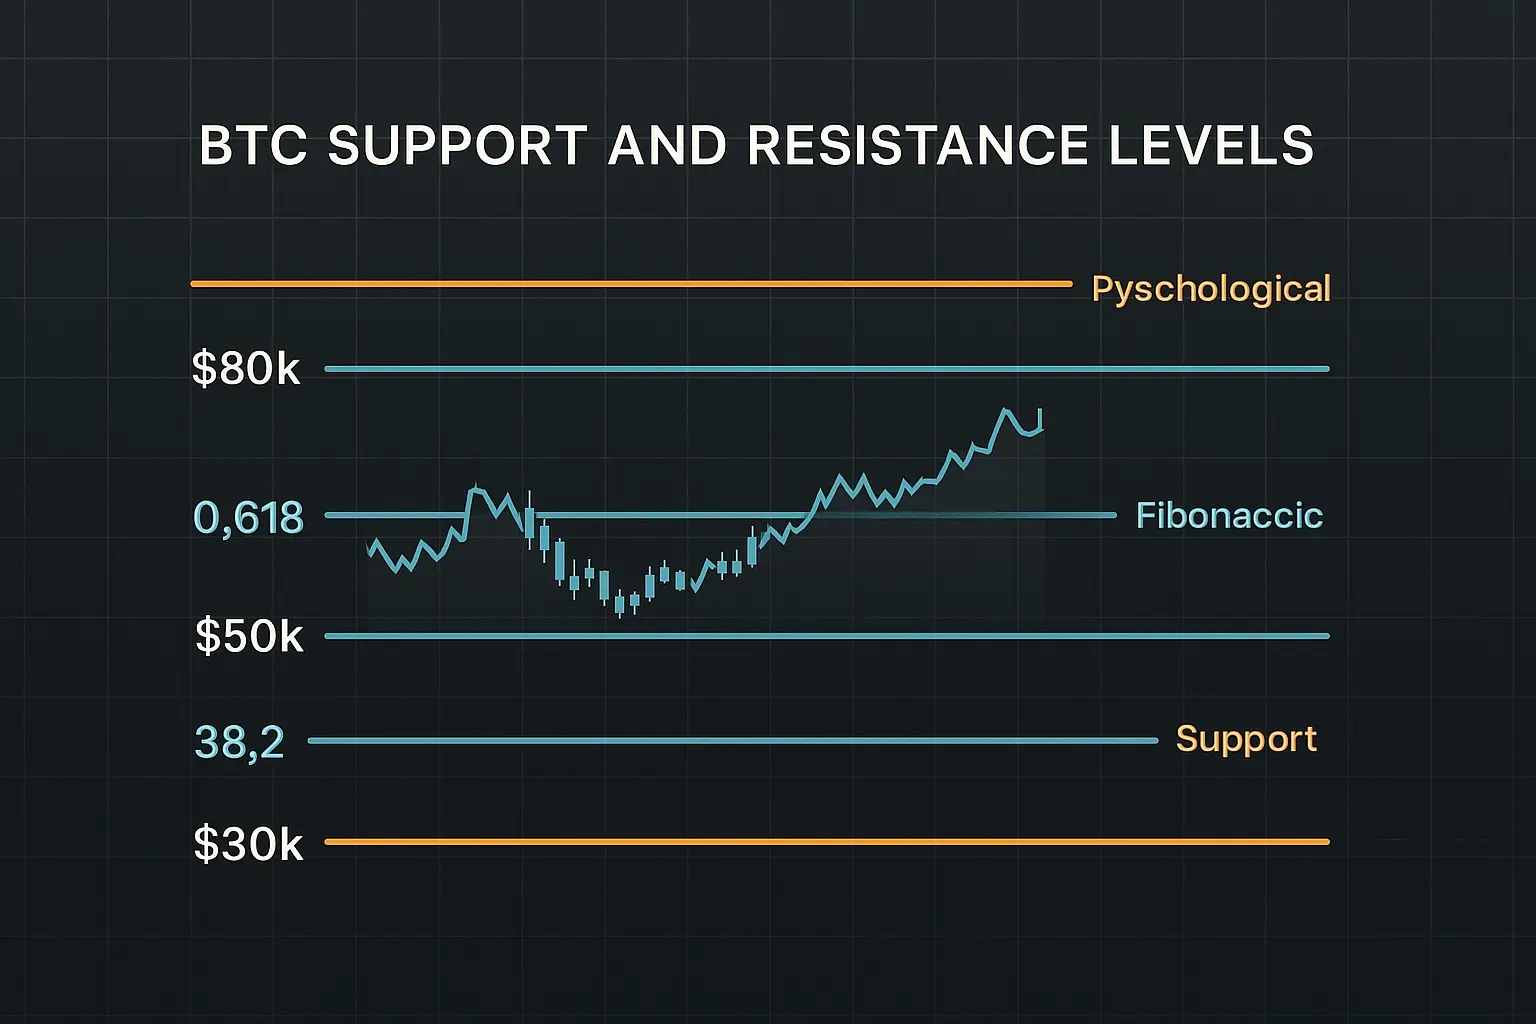
Examining the moving averages, the 7-day Hull Moving Average (HMA) on January 7th stood near 93,671 USD—a slight drop compared to previous days—while the 14- and 21-day HMAs also showed modest decreases. This suggests that the short-term bullish trend is losing steam, although the price remains above these averages, which is still a fundamentally positive sign. Regarding key support and resistance levels, the psychological support at 90,000 USD remains strong. Should this level fail to hold, the next support zones are at 89,855 to 88,379 USD and further down from 87,952 to 84,667 USD, which could help limit further declines. On the resistance side, important ranges lie between 92,513 to 94,005 USD and then 96,887 to 98,345 USD, where upward price movement may face obstacles.
The Fear & Greed Index currently reads 42, reflecting moderate fear, though it had dipped between 25 and 29 in recent days, indicating heightened market anxiety. This suggests that investors remain cautious and are not yet confident enough to drive a strong upward trend. A 3.7% decrease in open interest alongside a slightly positive funding rate points to a reduction in short positions, but bullish sentiment is not yet dominant. Additionally, ongoing global economic uncertainties continue to promote a conservative investor stance.
In summary, despite some recent positive price movement, Bitcoin’s market trend cannot be classified as fully bullish at this time. Short-term price corrections and reduced trading volume underscore a cautious sentiment, while signals from moving averages and Bollinger Bands imply the market may be transitioning from a neutral phase toward bearish tendencies. Maintaining the critical 90,000 USD support level is essential to prevent further declines, otherwise lower support zones could be tested. Given the current economic uncertainties and prevailing fear, investors are advised to exercise caution and await clearer market signals before making decisive moves.
Data Summary
- 1. Time:
2026-01-08 – 00:00 UTC - 2. Prices:
Open: 93747.97000000High: 93747.97000000Low: 90675.52000000Close: 91364.16000000
- 8. Supports:
S1: 89855.99000000 – 88379.88000000S2: 87952.01000000 – 84667.03000000S3: 84474.69000000 – 83949.52000000S4: 78595.9 – 76322.4
- 9. Resistances:
R1: 92513.38000000 – 94005.00000000R2: 96887.14000000 – 98345.00000000R3: 101109.59000000 – 101732.31000000R4: 104104 – 105500
- 10. Psychological Support:
90000.00000000
- 11. Psychological Resistance:
100000.00000000
- 3. Last 5 days’ closing prices:
2026-01-03: 90628.010000002026-01-04: 91529.730000002026-01-05: 93859.710000002026-01-06: 93747.970000002026-01-07: 91364.16000000
- 4. Volume:
BTC: 14276.4903USD: $1311906952.9750
- 5. Number of trades:
4340252
- 6. Indicators:
RSI: 56.5700MFI: 71.5100BB Upper: 93165.77000000BB Lower: 84758.85000000
- 7. Moving Averages:
SMA:7=91423.3900000014=89554.2200000021=88962.3100000030=89154.5100000050=89234.72000000100=99350.40000000200=106124.39000000EMA:
7=91452.1300000014=90372.6600000021=89979.9700000030=90109.0900000050=91720.27000000100=96495.42000000200=99859.27000000HMA:
7=93671.8100000014=93355.4300000021=92267.3600000030=90717.1200000050=88752.01000000100=84302.10000000200=86063.38000000 - 12. Funding Rate:
0.0029% (Technically Positive)
- 13. Open Interest:
92969.5230
- 14. Fear & Greed Index:
42 (Fear)
Disclaimer: This market analysis is generated by AI based on historical BTC data and sentiment indicators. Use it as a reference, not financial advice.
