
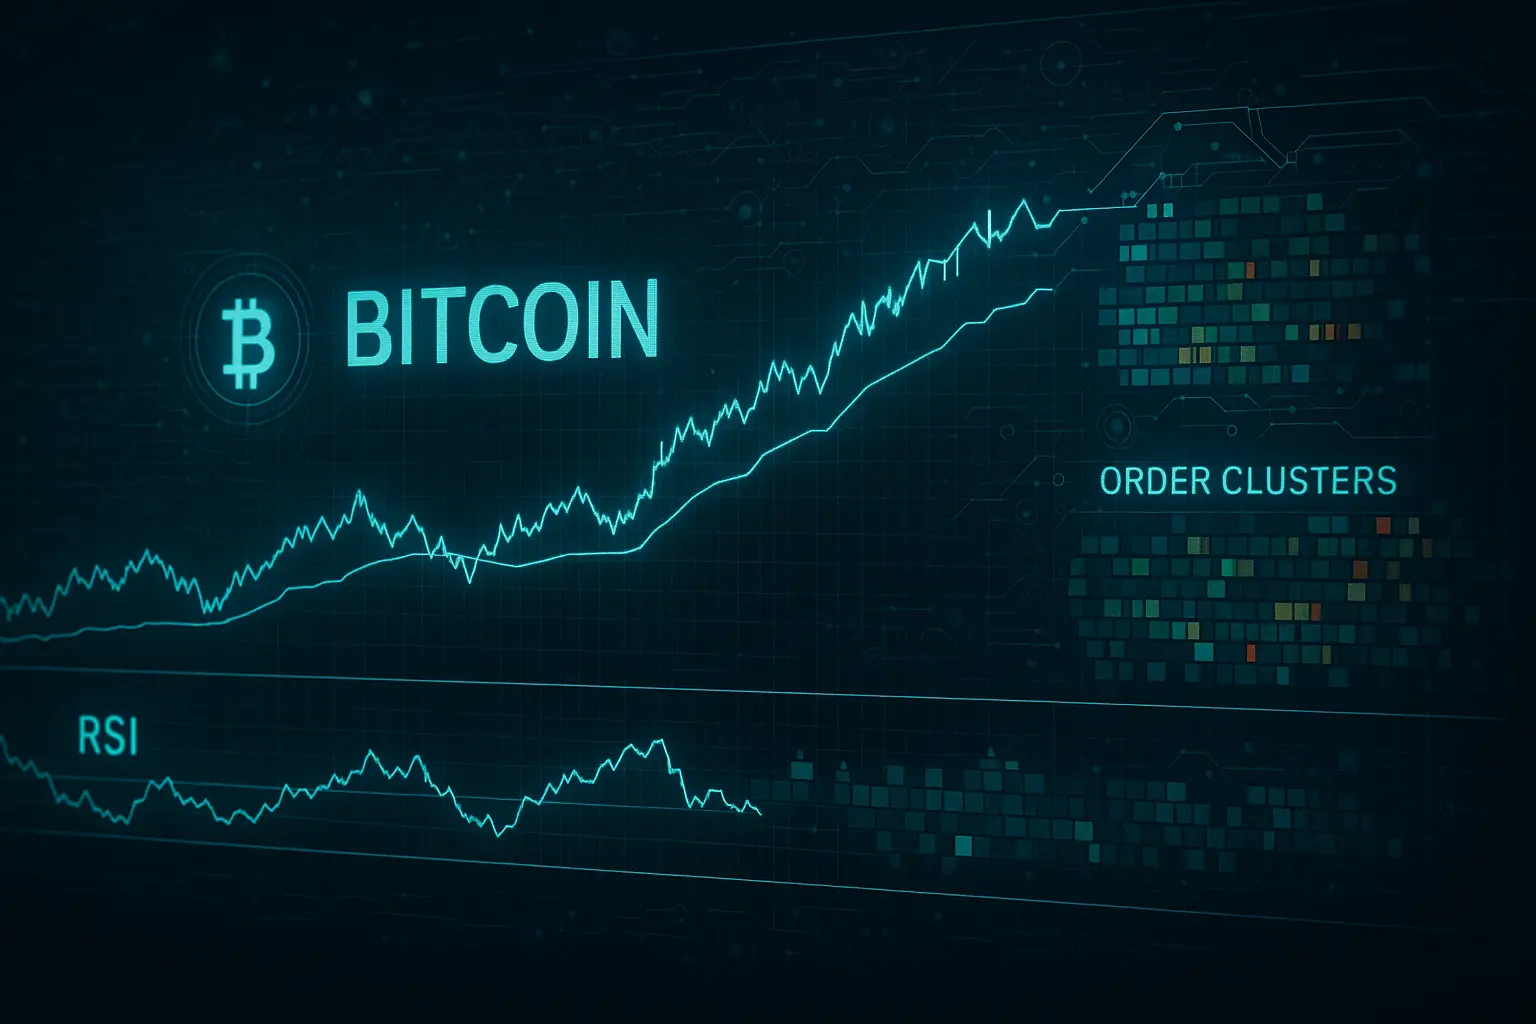
Market Analysis
Despite some positive movements in the crypto market, the overall trend remains cautious with a bearish inclination. The complexity of the global economic environment has affected investor confidence, maintaining a degree of uncertainty across the market.
Bitcoin’s price has experienced notable fluctuations over the past five days, reflecting prevailing market indecision. Between December 27 and December 31, price movements showed minor gains and losses, generally oscillating within a narrow range of 87,000 to 89,000. The Relative Strength Index (RSI) stayed between 48 and 55, indicating a neutral to slightly weak momentum. Similarly, the Money Flow Index (MFI) fluctuated between 48 and 71, suggesting some shifts in capital inflow but no definitive trend emerged. The Fear & Greed Index remained low, hovering between 21 and 24, signaling deep caution among investors who continue to adopt a conservative stance.
Examining the Bollinger Bands, Bitcoin’s price mostly clung close to the midline, with a slight dip below it on December 31, hinting at a tilt towards support but overall low volatility within a confined range. Hull Moving Averages (HMAs) for 7 and 14 days showed modest upward movement, yet the 200-day HMA remained above the price, indicating persistent long-term downward pressure. Notably, on December 31, the 7-day HMA was around 88,008 while the closing price was 87,648, reflecting mild weakness.
In terms of support levels, S1 lies between 87,486 and 86,184, serving as a strong support zone near current prices. Should this break, the next support (S2) ranges from 84,474 to 83,949, potentially halting further declines. Resistance levels are defined by R1 between 87,863 and 88,592, close to recent highs and likely to cap upward movement. Beyond that, R2 spans 92,513 to 94,005, representing a significant resistance barrier that must be surpassed to establish a robust uptrend. Psychological price points at 80,000 (support) and 90,000 (resistance) also hold substantial influence over market direction.
Market sentiment appears largely neutral, with funding rates near equilibrium (0.000038) and a slight decrease in open interest (-0.2025%), indicating a drop in major investments. Ongoing global economic uncertainties, unstable interest rates, and political tensions continue to temper investor enthusiasm, resulting in subdued activity within the crypto space. The low Fear & Greed Index further confirms prevailing apprehension, which generally places downward pressure on prices.
In summary, Bitcoin is currently in a cautious phase both technically and sentimentally. The RSI and MFI point toward slight weakness but do not signal any imminent sharp decline. The narrow Bollinger Bands and modest upward shifts in moving averages suggest the potential for a positive trend, albeit not a strong one. Price behavior near critical support and resistance levels indicates that a break below S1 could trigger a downward move, while overcoming R1 might lead to upward momentum. Given the ongoing global economic uncertainties and prevailing fear, investors should remain vigilant, considering both bullish and bearish scenarios in the short term.
Data Summary
- 1. Time:
2026-01-01 – 00:00 UTC - 2. Prices:
Open: 88485.50000000High: 89200.00000000Low: 87250.00000000Close: 87648.22000000
- 8. Supports:
S1: 87486.00000000 – 86184.39000000S2: 84474.69000000 – 83949.52000000S3: 78595.86000000 – 76322.42000000
- 9. Resistances:
R1: 87863.42000000 – 88592.74000000R2: 92513.38000000 – 94005.00000000R3: 96887.14000000 – 98345.00000000R4: 103262 – 104550
- 10. Psychological Support:
80000.00000000
- 11. Psychological Resistance:
90000.00000000
- 3. Last 5 days’ closing prices:
2025-12-27: 87877.010000002025-12-28: 87952.710000002025-12-29: 87237.130000002025-12-30: 88485.490000002025-12-31: 87648.22000000
- 4. Volume:
BTC: 11558.6205USD: $1019746835.2795
- 5. Number of trades:
2897396
- 6. Indicators:
RSI: 46.7600MFI: 63.5000BB Upper: 91035.08000000BB Lower: 85153.24000000
- 7. Moving Averages:
SMA:7=87685.0600000014=87731.7700000021=88094.1600000030=89035.1300000050=89854.93000000100=100734.71000000200=106684.22000000EMA:
7=87801.2800000014=87976.9400000021=88387.6300000030=89227.3400000050=91783.13000000100=97249.86000000200=100469.05000000HMA:
7=88008.2200000014=87738.3600000021=87673.6100000030=87116.1800000050=87227.31000000100=82989.47000000200=88158.50000000 - 12. Funding Rate:
0.0038% (Technically Positive)
- 13. Open Interest:
94709.6190
- 14. Fear & Greed Index:
21 (Extreme Fear)
Disclaimer: This market analysis is generated by AI based on historical BTC data and sentiment indicators. Use it as a reference, not financial advice.
