
Market Analysis
Today, the market is showing slight improvements, yet the overall trend remains cautious, oscillating between neutral and bearish sentiments. The complexities of the global economic environment continue to weigh on investor sentiment, sustaining an atmosphere of uncertainty within the crypto market.
Examining Bitcoin’s recent performance, its price has experienced modest fluctuations over the past five days, reflecting a stable yet uncertain trajectory. On December 23rd, Bitcoin opened at 88,620 and closed at 87,486, followed by a gradual rise to 87,877 by December 27th. The 7-day RSI moved from 42.55 to 48.33, indicating a neutral zone with a slight positive inclination. Similarly, the 14-day Money Flow Index (MFI) increased from 40.31 to 48.35, suggesting a marginal improvement in financial inflows, though it remains distant from overbought or oversold levels. These indicators suggest the absence of strong buying or selling pressure, pointing instead to a moderate balance in the market.
Looking at the Bollinger Bands, the price has mostly hovered near the midline, which is around 88,779, with fluctuations between 84,814 and 92,745. This reflects low volatility and a price confined within a narrow range. Moving averages (HMA) data show the 7-day HMA close to 87,382, slightly below or nearly equal to the 14 and 21-day HMAs, indicating a weak but steady short-term trend. The 50 and 100-day HMAs are also near the current price, further underscoring market uncertainty.
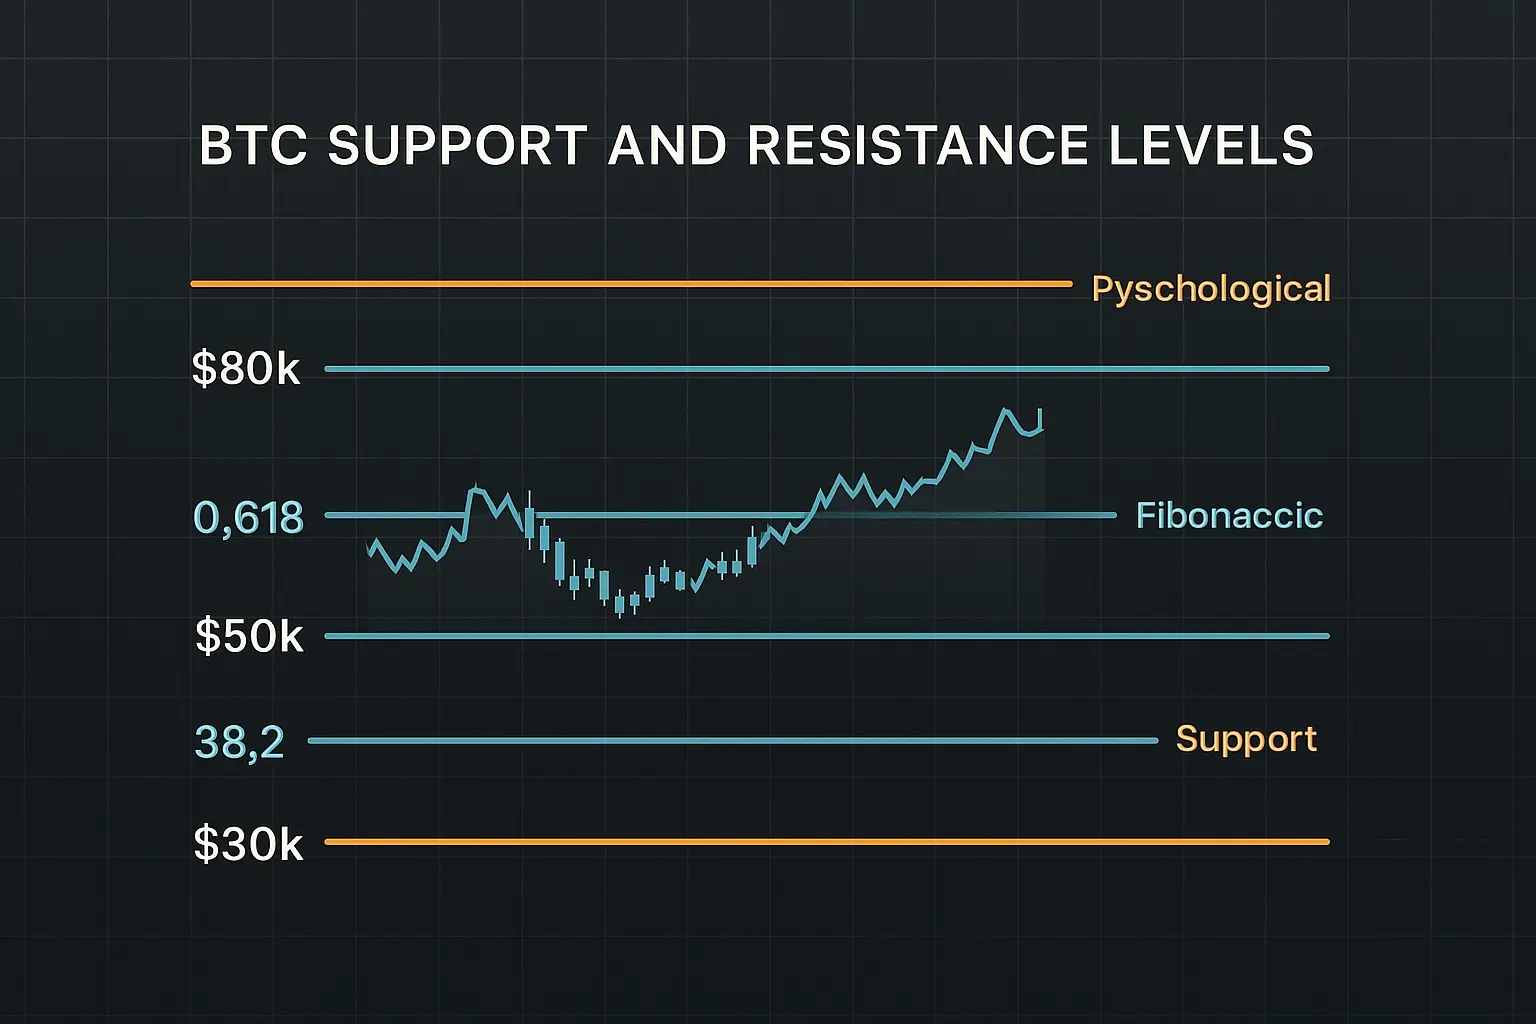
Regarding support and resistance levels, Bitcoin’s price currently resides within the first support zone between 87,486 and 86,184, providing immediate protection. Should this support break, the next zone between 84,739 and 83,111 could offer additional downside defense. Resistance levels lie between 88,300 and 89,567, presenting potential obstacles to upward movement. Psychological support and resistance at 80,000 and 90,000 respectively remain key milestones for market participants. The Fear and Greed Index ranges from 20 to 24, signaling a state of fear—albeit not extreme—indicating that investors remain cautious and are avoiding significant buying or selling activity.
On the news front, ongoing global economic uncertainties and political tensions continue to pressure the crypto market. The lack of clear progress in trade relations between the US and China is a negative factor, while signs of economic slowdown in the European Union are also dampening investor confidence. Against this backdrop, significant price swings in Bitcoin are unlikely, with the market expected to move largely sideways. The MACD indicator reflects a weak positive signal, mirroring the prevailing uncertainty.
Overall, Bitcoin’s current price reflects a cautious equilibrium where both bullish and bearish factors coexist. The neutral readings from RSI and MFI suggest a pause before any major move. The narrow Bollinger Bands and convergence of moving averages further confirm the absence of a decisive trend. The presence of defined support and resistance levels advises investors to remain vigilant, especially amid uncertain global economic conditions. The Fear and Greed Index’s emphasis on fear points to potential short-term volatility, while long-term investors would benefit from patience and a careful strategy. At this stage, avoiding impulsive actions and closely monitoring technical indicators would be the prudent approach.
Data Summary
- 1. Time:
2025-12-28 – 00:00 UTC - 2. Prices:
Open: 87369.56000000High: 87984.00000000Low: 87253.05000000Close: 87877.01000000
- 8. Supports:
S1: 87486.00000000 – 86184.39000000S2: 84739.74000000 – 83111.64000000S3: 78595.86000000 – 76322.42000000
- 9. Resistances:
R1: 88300.01000000 – 89567.75000000R2: 92513.38000000 – 94005.00000000R3: 96887.14000000 – 98345.00000000R4: 103262 – 104550
- 10. Psychological Support:
80000.00000000
- 11. Psychological Resistance:
90000.00000000
- 3. Last 5 days’ closing prices:
2025-12-23: 87486.000000002025-12-24: 87669.450000002025-12-25: 87225.270000002025-12-26: 87369.560000002025-12-27: 87877.01000000
- 4. Volume:
BTC: 4469.5516USD: $391274205.2744
- 5. Number of trades:
957536
- 6. Indicators:
RSI: 48.3300MFI: 48.3500BB Upper: 92745.66000000BB Lower: 84814.12000000
- 7. Moving Averages:
SMA:7=87843.8500000014=87545.1500000021=88779.8900000030=89268.9900000050=91150.58000000100=101857.71000000200=107013.02000000EMA:
7=87717.0300000014=88085.5300000021=88644.2500000030=89653.4600000050=92468.70000000100=98034.30000000200=100984.81000000HMA:
7=87382.2200000014=87733.4200000021=87301.9600000030=86770.2600000050=87530.43000000100=83056.21000000200=89743.43000000 - 12. Funding Rate:
0.0059%
- 13. Open Interest:
92492.5500
- 14. Fear & Greed Index:
23 (Extreme Fear)
Disclaimer: This market analysis is generated by AI based on historical BTC data and sentiment indicators. Use it as a reference, not financial advice.
