
Market Analysis
The crypto market is showing signs of slight recovery today, but the overall trend remains mixed and uncertain. Due to ongoing global economic pressures, investors are adopting a cautious approach, maintaining a clear balance amid market fluctuations.
Over the past five days, Bitcoin has experienced some positive movements; however, these fluctuations have been relatively limited, and the market has yet to establish a definitive direction. On December 8th, Bitcoin opened at 90,395 and closed slightly higher at 90,634. The following day saw a notable price increase, peaking at 94,588. Yet, by December 12th, the price slipped again, closing at 90,268. The RSI (7) indicator dropped from 50.57 to 45.33 during this period, signaling moderate weakness. Similarly, the MFI (14) decreased from 58.26 to 51.59, reflecting reduced liquidity and cautious buying behavior. The Fear & Greed Index rose from 20 to 29—still in the fear zone but showing signs of improvement.
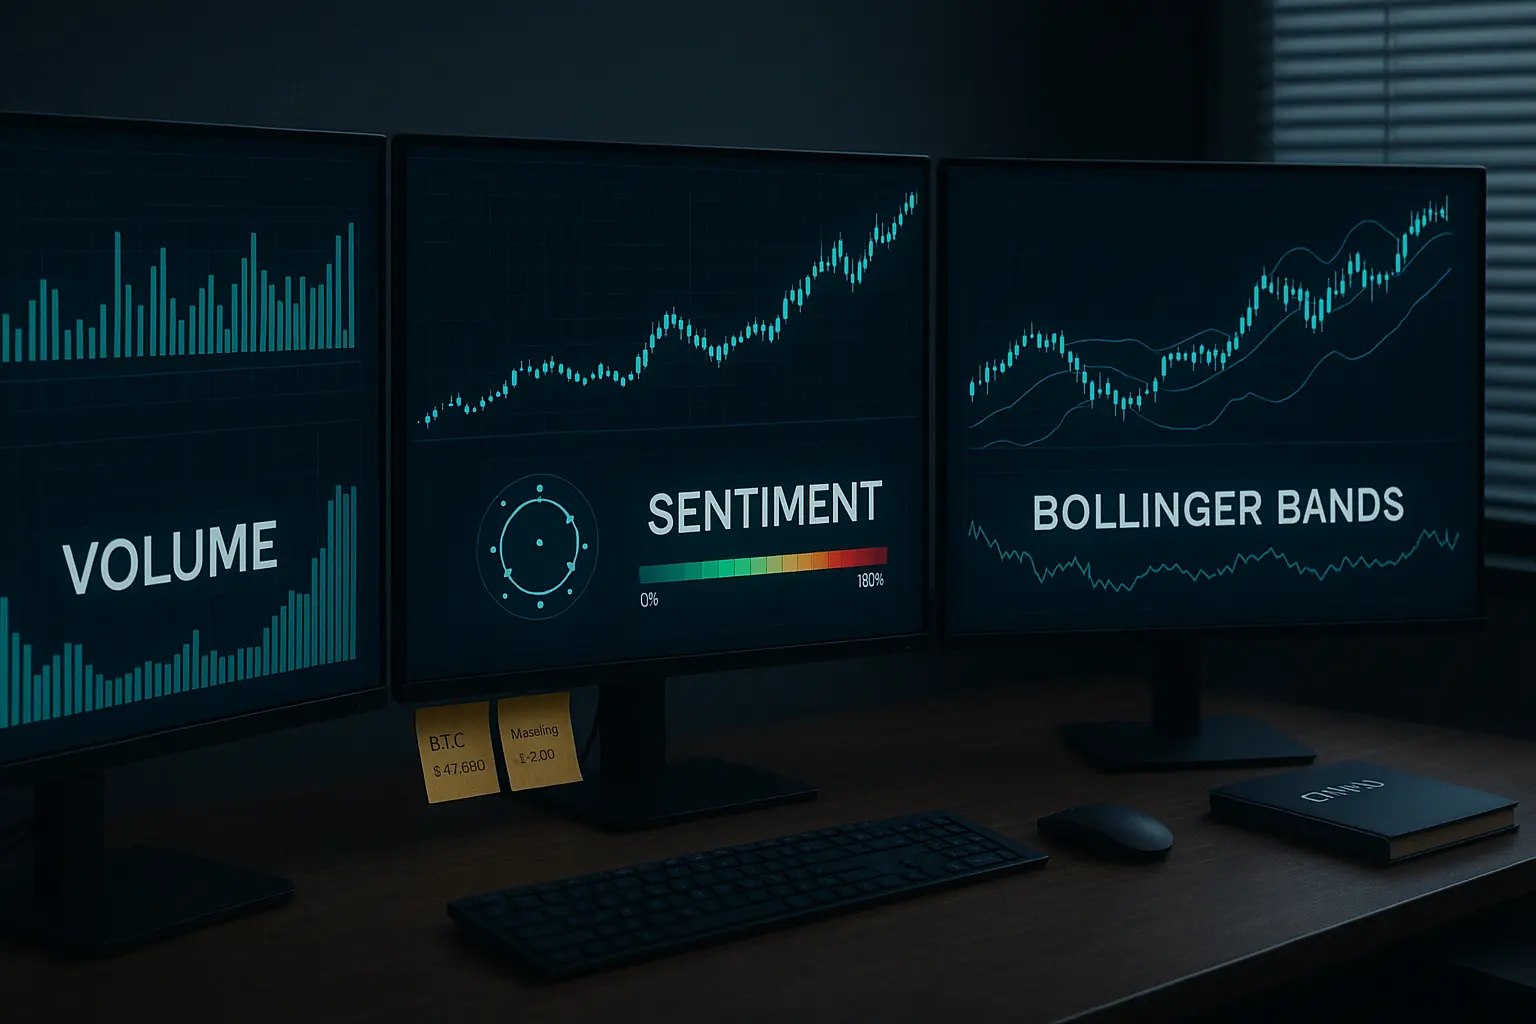
Looking at the Bollinger Bands, Bitcoin closed near the midline at 90,059 on December 12th, which is acting as a support level. Price movements have remained within a narrow range between the upper band at 94,462 and the lower band at 85,657, indicating low volatility and consolidation—a potential setup for a significant move ahead. Supporting this view, the Hull Moving Averages (HMA) for 7 and 14 days stand at 91,851 and 91,787 respectively, levels close to the current price that reflect market equilibrium.
In terms of support levels, the closest zone lies between 87,369 and 85,800. If this breaks, the next support range falls between 84,739 and 83,111, followed by a third zone from 82,715 to 80,818. On the resistance side, the first key range is from 90,375 to 93,555, near recent highs. Beyond that, resistance levels stretch from 94,270 to 95,461 and then 96,887 to 98,345. Psychological thresholds at 90,000 (support) and 100,000 (resistance) remain critical markers for market participants.
Global economic conditions and recent developments continue to influence market sentiment. Economic slowdown and rising inflation in the US and Europe have made investors more cautious, while signs of regulatory easing in China’s crypto policies offer some optimism. However, expectations of interest rate hikes by major financial institutions are keeping pressure on the market. Slight increases in financing rates and open interest suggest ongoing investor engagement, though risk appetite remains muted.
The MACD trend also appears neutral, confirming that neither bullish nor bearish momentum dominates at present. Current RSI and MFI levels, along with their downward trends, tilt the market slightly towards bearish sentiment. The Fear & Greed Index similarly reflects a cautious mood. Although Bitcoin showed some strength in recent days, the price dip on December 12th serves as a warning that bearish forces are still at play.
Overall, Bitcoin’s market remains in a delicate balance characterized by minor positive signals but an underlying neutral to bearish bias. Investors should closely monitor key support and resistance levels, along with global economic indicators and technical signals. Given the prevailing uncertainty, hasty decisions should be avoided, as the price may soon make a significant move. A careful and disciplined strategy is essential to navigate this environment effectively.
Data Summary
- 1. Time:
2025-12-13 – 00:00 UTC - 2. Prices:
Open: 92513.38000000High: 92754.00000000Low: 89480.00000000Close: 90268.42000000
- 8. Supports:
S1: 87369.96000000 – 85800.00000000S2: 84739.74000000 – 83111.64000000S3: 82715.03000000 – 80818.84000000S4: 76322.4 – 76239.9
- 9. Resistances:
R1: 90375.20000000 – 93555.00000000R2: 94270.00000000 – 95461.53000000R3: 96887.14000000 – 98345.00000000R4: 103262 – 104550
- 10. Psychological Support:
90000.00000000
- 11. Psychological Resistance:
100000.00000000
- 3. Last 5 days’ closing prices:
2025-12-08: 90634.340000002025-12-09: 92678.800000002025-12-10: 92015.370000002025-12-11: 92513.380000002025-12-12: 90268.42000000
- 4. Volume:
BTC: 16679.1917USD: $1521683425.5648
- 5. Number of trades:
4956719
- 6. Indicators:
RSI: 45.3300MFI: 51.5900BB Upper: 94462.33000000BB Lower: 85657.21000000
- 7. Moving Averages:
SMA:7=91106.0600000014=90807.6300000021=90059.7700000030=90796.5500000050=97422.30000000100=105731.77000000200=108470.26000000EMA:
7=91221.0400000014=91108.3700000021=91666.2500000030=93012.6300000050=96383.47000000100=101644.58000000200=103131.55000000HMA:
7=91851.3300000014=91787.9900000021=91818.9000000030=91437.0800000050=87002.21000000100=86463.87000000200=96518.07000000 - 12. Funding Rate:
0.0034% (Technically Positive)
- 13. Open Interest:
87102.9540
- 14. Fear & Greed Index:
29 (Fear)
Disclaimer: This market analysis is generated by AI based on historical BTC data and sentiment indicators. Use it as a reference, not financial advice.
