
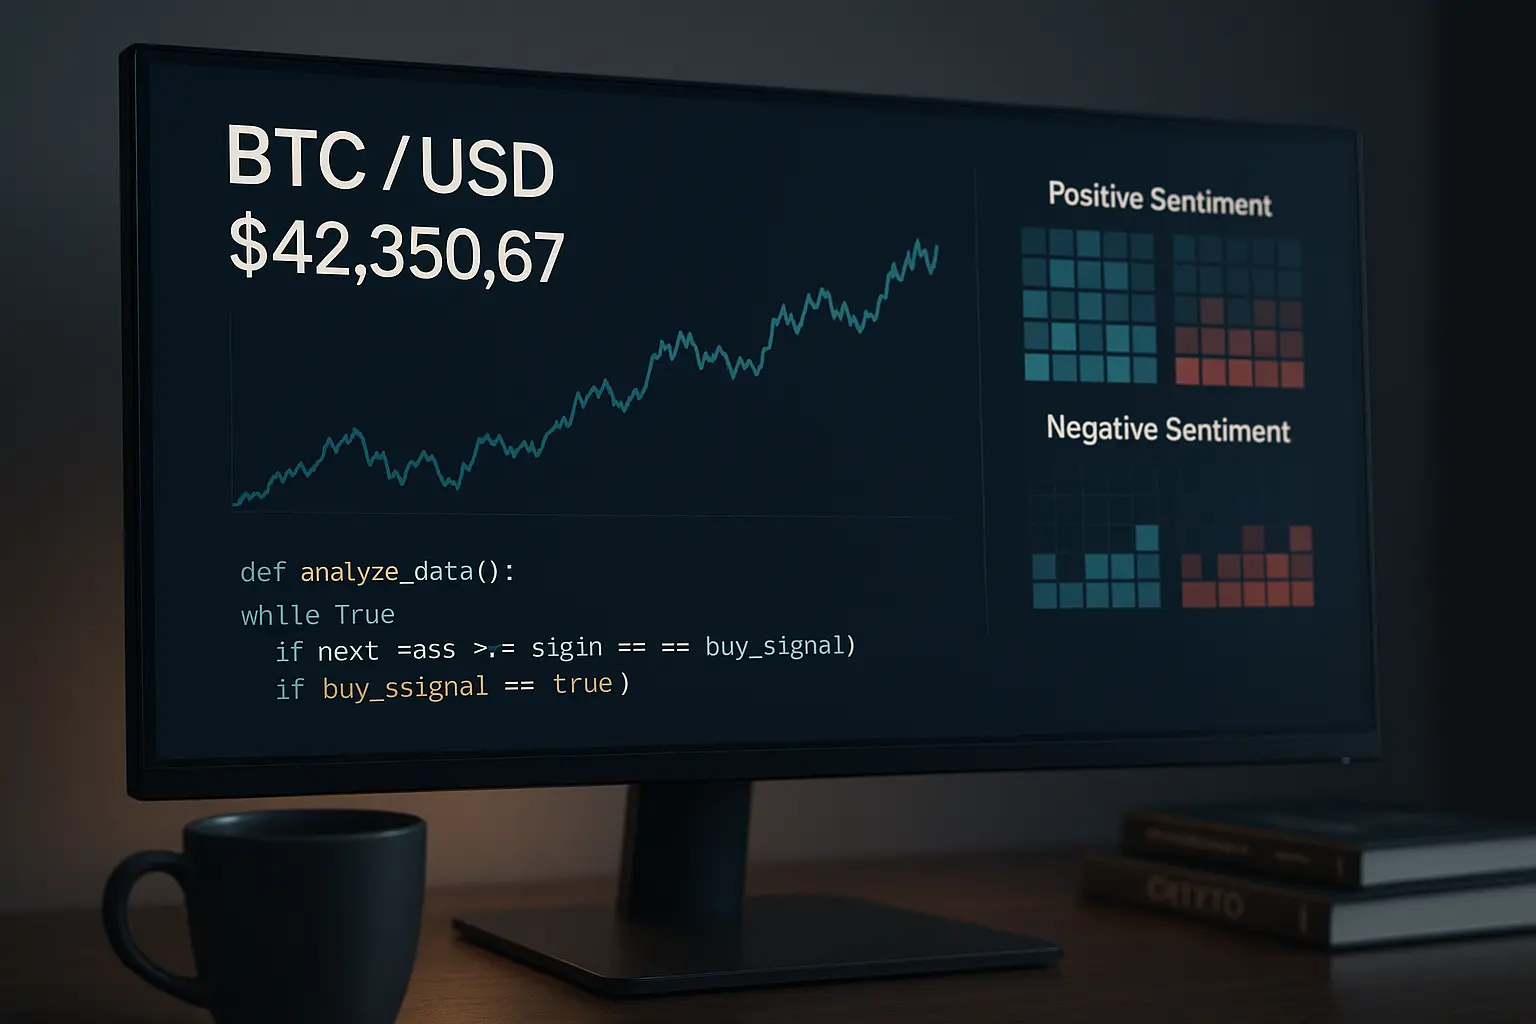
Market Analysis
The cryptocurrency market is showing slight improvement today, although the overall trend remains cautious, leaning from neutral towards bearish. Persistent challenges in the global economy have weakened investor confidence, which continues to influence the market’s direction.
Over the past five days, Bitcoin’s price has exhibited volatility, with technical indicators sending mixed signals—underscoring the absence of a clear market direction at this stage. Key metrics such as the Relative Strength Index (RSI) and Money Flow Index (MFI) remain at moderate levels, while the Fear and Greed Index signals persistent uncertainty and lack of strong conviction among investors.
Bitcoin closed near 92,015, reflecting a modest upward momentum in recent days. However, significant challenges still loom. The widening of Bollinger Bands suggests potential for continued price fluctuations, while moving averages advise caution.
This analysis examines technical data, current market conditions, and global economic factors to assess Bitcoin’s short-term prospects and help investors make informed decisions.
During the last five days, Bitcoin’s price showed a moderate but active trend. On December 6, it opened at 89,330 and closed at 89,236, with the RSI at 44.1—indicating mild weakness to the downside. The MFI reading of 60.4 pointed to relatively strong liquidity and buying interest, but the Fear and Greed Index remained low at 23, reflecting ongoing market apprehension. On December 7, the price rose to 90,395, with the RSI improving to 49.43, signaling a move toward a more neutral stance. Trading volume and activity also increased, suggesting growing market interest.
Further gains were observed on December 8 and 9, with Bitcoin reaching 92,678 on the 9th. The RSI climbed to 59.61, indicating a cautiously positive short-term trend, while the MFI increased to 65.95, reflecting buying pressure. However, the Fear and Greed Index hovered between 20 and 22, still pointing to a fearful but not extreme market sentiment. During this period, Bollinger Bands widened, highlighting the potential for price swings. On December 10, a slight pullback brought the price to 92,015, with the RSI at 55.75—suggesting a modest but still positive trend. The 7-day Hull Moving Average (HMA) rose recently, with prices maintaining above it, signaling a weak ongoing uptrend. The 14, 21, and 30-day moving averages are also trending upward, though the 200-day moving average remains well above current prices, indicating a longer-term bearish outlook.
Support levels are critical at this juncture. The nearest support zone (S1) lies between 91,965 and 90,357, close to the current price and potentially providing strong backing. Should this range break down, the next support (S2) between 87,369 and 85,800 will serve as an important safety net. Additional lower supports (S3 and S4) exist further below. A psychological support level at 90,000 is significant; if breached, it could intensify bearish momentum. On the resistance side, R1 ranges from 94,270 to 95,461, near recent highs. Surpassing this zone may open the path toward higher resistance levels (R2 and R3). The key psychological resistance at 100,000 remains a major hurdle.
The MACD indicator recently attempted a bullish crossover, raising the odds for short-term buying opportunities, though its strength remains limited. Increases in trading volume and transaction counts point to growing interest, yet the persistently low Fear and Greed Index combined with global economic uncertainties continue to weigh on investor confidence. Minor upticks in financing rates and open interest hint at a degree of market stabilization, but caution prevails.
Global economic developments are also impacting Bitcoin’s price. Slowing growth, high inflation rates, and geopolitical tensions worldwide have dampened the investment climate. Economic uncertainty in the US and Europe has contributed to a cautious stance among crypto investors. Moreover, tightening monetary policies and rising interest rates by central banks add pressure on the market’s trajectory. These factors may constrain Bitcoin’s price in the short term, while longer-term stability will likely depend on more positive economic news.
Overall, considering Bitcoin’s current technical picture and the broader economic environment, there is a mild positive momentum in the short term, but it has not yet solidified. The presence of clearly defined support and resistance levels, along with moderate technical indicators, suggests investors should remain cautious and avoid hasty decisions. The ongoing global economic uncertainty and subdued market sentiment indicated by the Fear and Greed Index point to continued volatility ahead. Consequently, careful monitoring and a measured approach are advisable as Bitcoin’s price is likely to experience cautious fluctuations in the coming days.
Data Summary
- 1. Time:
2025-12-11 – 00:00 UTC - 2. Prices:
Open: 92678.81000000High: 94476.00000000Low: 91563.15000000Close: 92015.37000000
- 8. Supports:
S1: 91965.16000000 – 90357.00000000S2: 87369.96000000 – 85800.00000000S3: 84739.74000000 – 83111.64000000S4: 78595.9 – 76322.4
- 9. Resistances:
R1: 94270.00000000 – 95461.53000000R2: 96887.14000000 – 98345.00000000R3: 103261.60000000 – 104550.33000000R4: 104556 – 105500
- 10. Psychological Support:
90000.00000000
- 11. Psychological Resistance:
100000.00000000
- 3. Last 5 days’ closing prices:
2025-12-06: 89236.790000002025-12-07: 90395.310000002025-12-08: 90634.340000002025-12-09: 92678.800000002025-12-10: 92015.37000000
- 4. Volume:
BTC: 18998.6808USD: $1758773276.2478
- 5. Number of trades:
6025707
- 6. Indicators:
RSI: 55.7500MFI: 65.7000BB Upper: 94433.03000000BB Lower: 84637.45000000
- 7. Moving Averages:
SMA:7=90909.8200000014=90767.8300000021=89535.2400000030=91527.6000000050=98119.58000000100=106108.73000000200=108618.47000000EMA:
7=91213.6400000014=91041.3200000021=91735.3000000030=93249.3700000050=96801.21000000100=102063.52000000200=103368.84000000HMA:
7=92636.0200000014=91221.4400000021=91418.9400000030=90762.6900000050=86100.86000000100=87060.74000000200=97409.90000000 - 12. Funding Rate:
0.0032% (Technically Positive)
- 13. Open Interest:
88590.6330
- 14. Fear & Greed Index:
26 (Fear)
Disclaimer: This market analysis is generated by AI based on historical BTC data and sentiment indicators. Use it as a reference, not financial advice.
