
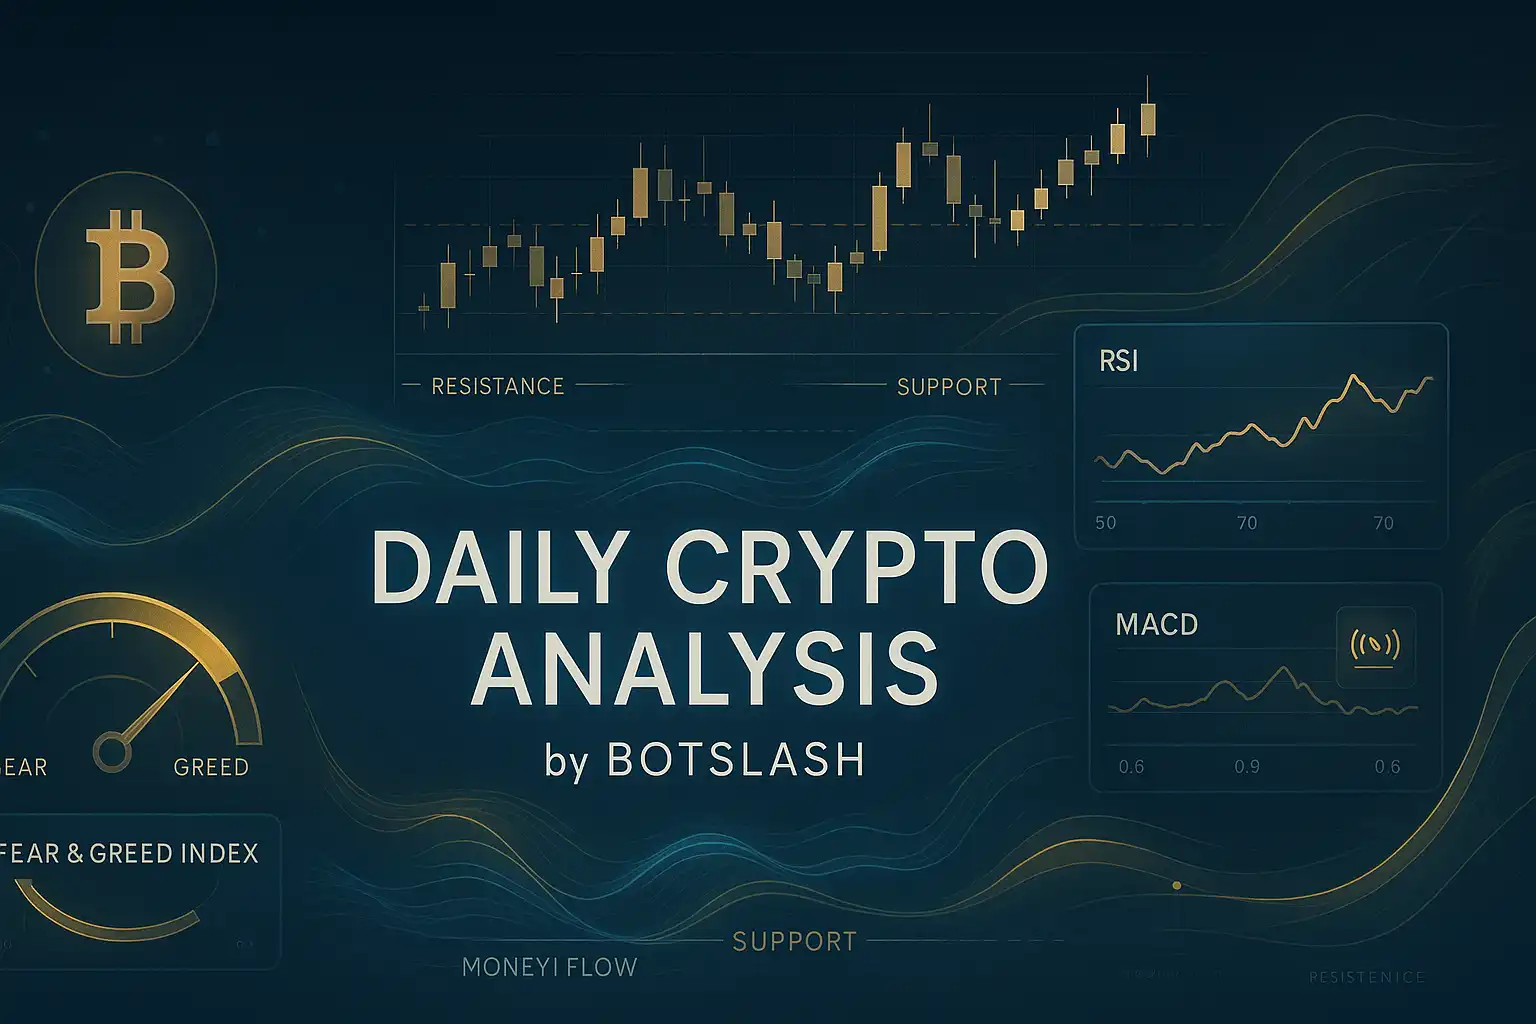
Market Analysis
The current market analysis indicates slight signs of improvement; however, the overall trend remains uncertain and somewhat pressured. Ongoing complexities in the global economy continue to unsettle the investment landscape, making it difficult to establish a clear direction for Bitcoin’s price movement.
Examining the data and technical indicators from the past five days reveals that despite fluctuations, Bitcoin has yet to establish a strong trend. On November 28, the price opened at 91,333 and closed slightly lower at 90,890. The following two days saw modest declines, and on December 1, the price suddenly dropped sharply to 83,822 before recovering to close at 86,286. December 2 witnessed a bullish attempt as the market pushed the price back up to 91,277. The RSI (7) values ranged from 49.54 to 53.58, reflecting market indecision, while the MFI (14) increased from 28.85 to 43.25. This suggests some improvement in investment flow, though it remains well below oversold conditions.
Bollinger Bands analysis shows that the price touched the lower band on December 1, hinting at a potential support level, and closed near the middle band on December 2, indicating a degree of market stabilization. Volume spiked significantly on December 1, signaling intense selling pressure, but rose again with buying activity on December 2. The Fear & Greed Index hovered between 23 and 28, indicating prevailing fear but not an extreme panic, suggesting cautious investor interest.
Moving averages (HMA) further illustrate the current state: the 7-day HMA is around 88,437, close to the current price, while the 14-day and 21-day HMAs stand at 90,554 and 89,296, respectively. This proximity implies no clear short- or mid-term upward momentum, with prices oscillating around these averages. Support levels appear robust between 89,855 and 87,952, as well as between 87,369 and 85,800. Resistance lies between 91,333 and 92,307. A close above 91,333 could signal a positive shift, whereas failure to break this resistance may lead to further downside toward support zones.
Considering the broader economic environment—particularly ongoing trade tensions between the U.S. and China and sluggish growth in Europe—investors remain cautious. Additionally, increased regulatory scrutiny within the crypto market and conservative statements from international financial institutions have influenced market sentiment. Against this backdrop, despite short-term price volatility, achieving sustained long-term stability for Bitcoin remains challenging.
In summary, Bitcoin’s market currently occupies a neutral to bearish phase. Although modest gains have been observed, risks persist. Technical indicators and volume trends suggest that surpassing the 91,333 resistance level could bring short-term improvement; however, failure to do so may result in further declines toward support levels. Given the prevailing global economic uncertainties and the current level of market fear, investors are advised to exercise caution and avoid hasty decisions in this environment.
Data Summary
- 1. Time:
2025-12-03 – 00:00 UTC - 2. Prices:
Open: 86286.01000000High: 92307.65000000Low: 86184.39000000Close: 91277.88000000
- 8. Supports:
S1: 89855.99000000 – 87952.01000000S2: 87369.96000000 – 85800.00000000S3: 84739.74000000 – 83111.64000000S4: 78595.9 – 76322.4
- 9. Resistances:
R1: 91333.95000000 – 92307.65000000R2: 96887.14000000 – 98345.00000000R3: 101109.59000000 – 101732.31000000R4: 104104 – 105500
- 10. Psychological Support:
90000.00000000
- 11. Psychological Resistance:
100000.00000000
- 3. Last 5 days’ closing prices:
2025-11-28: 90890.700000002025-11-29: 90802.440000002025-11-30: 90360.000000002025-12-01: 86286.010000002025-12-02: 91277.88000000
- 4. Volume:
BTC: 28210.2273USD: $2519515177.6624
- 5. Number of trades:
6397299
- 6. Indicators:
RSI: 53.5800MFI: 43.2500BB Upper: 99744.42000000BB Lower: 82443.23000000
- 7. Moving Averages:
SMA:7=90205.0000000014=88714.0200000021=91093.8300000030=94857.5600000050=100985.10000000100=107657.12000000200=109126.13000000EMA:
7=89698.5800000014=90568.4600000021=92303.4900000030=94673.3500000050=98904.60000000100=103944.42000000200=104380.36000000HMA:
7=88437.8100000014=90554.6000000021=89296.8000000030=86235.3500000050=85156.31000000100=90830.59000000200=101469.51000000 - 12. Funding Rate:
0.004% (Technically Positive)
- 13. Open Interest:
88384.9840
- 14. Fear & Greed Index:
23 (Extreme Fear)
Disclaimer: This market analysis is generated by AI based on historical BTC data and sentiment indicators. Use it as a reference, not financial advice.
