
Market Analysis
Bitcoin has recently struggled to demonstrate strong upward momentum, failing to surpass the critical 124,000 mark despite the Federal Reserve’s interest rate cuts. This has contributed to growing uncertainty in the market, signaling the need for investors to exercise caution amid the looming risk of a potential downturn.
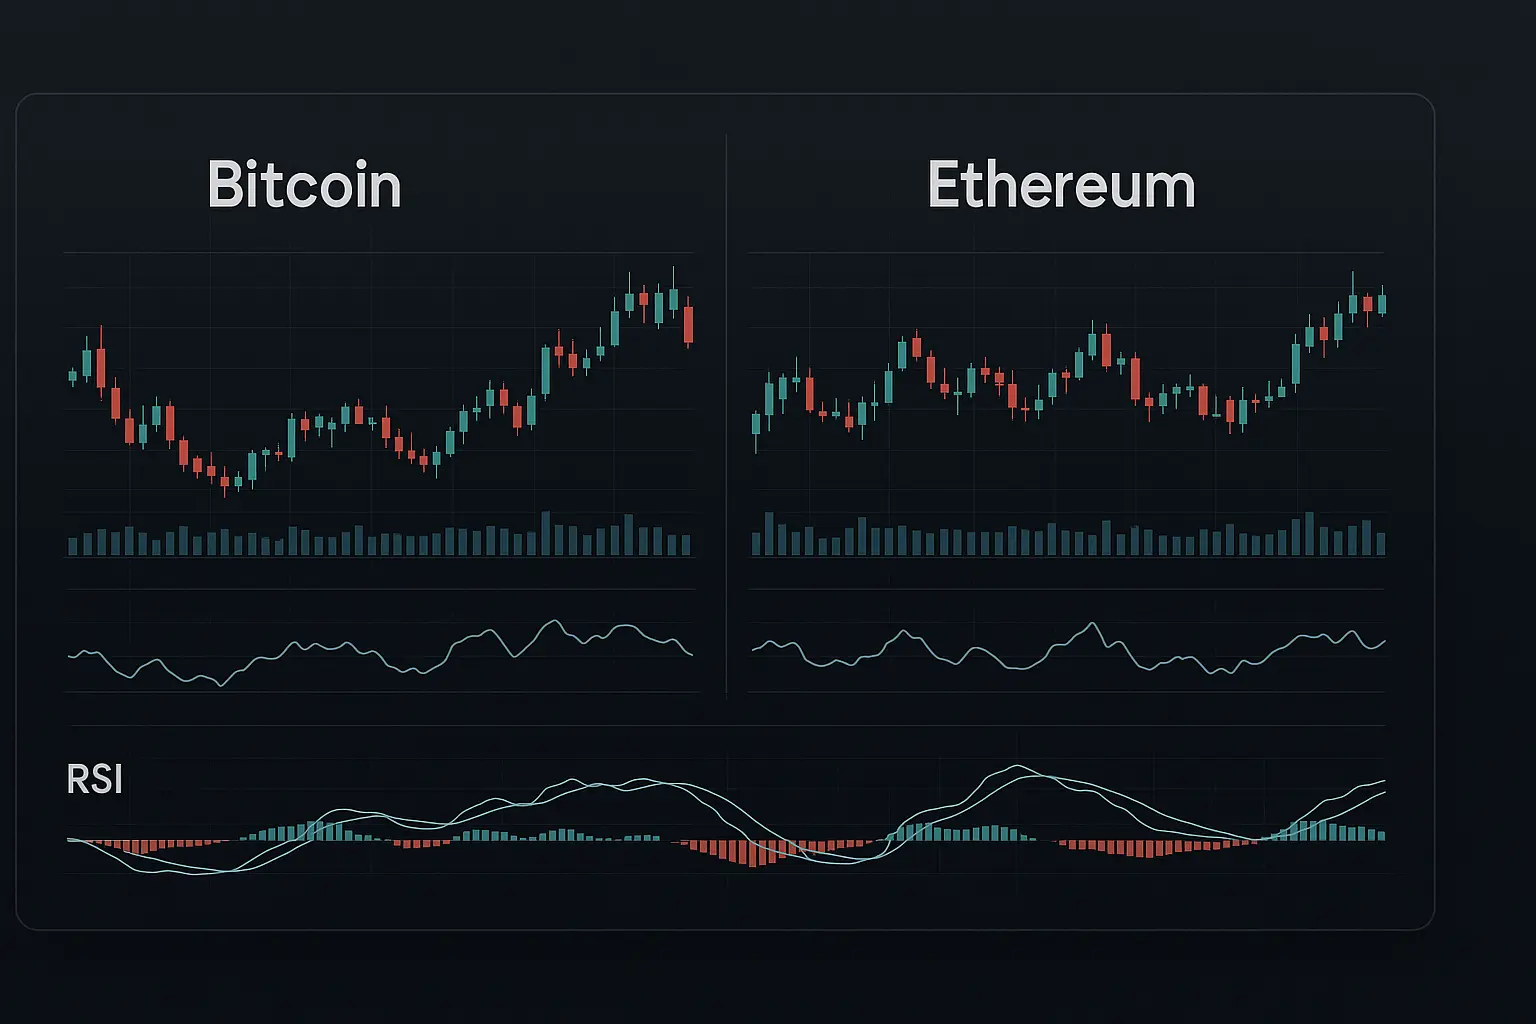
Over the past five days, Bitcoin’s price has experienced notable volatility, moving from 103,885 to 106,011 without establishing clear stability. The RSI (7) indicator rose from 28.44 to 50.51, suggesting that while there is some strengthening, overall buying pressure remains weak. Similarly, the MFI (14) fluctuated between 33.82 and 38.18, reflecting subdued liquidity and a cautious investment approach in the medium term. The Fear and Greed Index, hovering between 20 and 29, indicates prevailing fear, which could point to bearish momentum in the short run.
Analysis of Bollinger Bands shows that the price has faced pressure near the lower band but has recently attempted to push toward the upper band. This movement highlights the market’s indecision as prices range within a relatively narrow corridor. Examining the moving averages, the 7-day Hull Moving Average (HMA) demonstrates strength around 105,418, whereas the 14- and 21-day HMAs remain slanted downward, suggesting mixed signals—improvements in the short term are counterbalanced by ongoing medium-term pressure.
From a support and resistance perspective, Bitcoin has found solid support near the S1 range between 105,681 and 104,872, while resistance is encountered within the R1 range of 106,066 to 106,670. Failure to break above R1 could shift focus to the S2 range between 101,508 and 99,950. The psychological support level at 100,000 remains a crucial threshold; dipping below this could confirm bearish sentiment. Meanwhile, a 1.44% increase in open interest combined with a positive funding rate indicates that some investors continue to maintain interest in Bitcoin, though overall market sentiment remains cautious.
Despite the Fed’s rate cuts, Bitcoin’s price has not shown significant gains, reflecting ongoing economic concerns and global financial uncertainties. Additionally, the cautious stance of major investors and fluctuations in trading volume add complexity to the current market environment. MACD indicators display mixed signals as well, with short-term attempts at a bullish crossover countered by continued downward pressure in the medium term.
Overall, Bitcoin’s current state reflects a delicate balance: there are signs of short-term improvement, but medium-term bearish risks persist. Investors would be wise to carefully monitor support and resistance levels and avoid hasty decisions, as prices may decline at any time. The prevailing fear and weak volume contribute to short-term directional uncertainty. However, surpassing the R1 resistance range could lead to a more positive trend. Given these factors, maintaining a cautious approach is the most prudent strategy at present.
Data Summary
- 1. Time:
2025-11-11 – 00:00 UTC - 2. Prices:
Open: 104722.95000000High: 106670.11000000Low: 104265.02000000Close: 106011.13000000
- 8. Supports:
S1: 105681.14000000 – 104872.50000000S2: 101508.68000000 – 99950.77000000S3: 96945.63000000 – 90056.17000000S4: 87325.6 – 86310
- 9. Resistances:
R1: 106066.59000000 – 106670.11000000R2: 111696.21000000 – 112371.00000000R3: 116788.96000000 – 117543.75000000R4: 123306 – 124197
- 10. Psychological Support:
100000.00000000
- 11. Psychological Resistance:
110000.00000000
- 3. Last 5 days’ closing prices:
2025-11-06: 101346.040000002025-11-07: 103339.080000002025-11-08: 102312.940000002025-11-09: 104722.960000002025-11-10: 106011.13000000
- 4. Volume:
BTC: 22682.2567USD: $2400141664.3893
- 5. Number of trades:
4710957
- 6. Indicators:
RSI: 50.5100MFI: 38.1800BB Upper: 115866.63000000BB Lower: 100176.08000000
- 7. Moving Averages:
SMA:7=103302.0800000014=106513.3600000021=108021.3600000030=108778.3500000050=111857.96000000100=113004.99000000200=109488.46000000EMA:
7=104735.3800000014=106084.9600000021=107329.4400000030=108560.9300000050=110207.10000000100=110965.19000000200=107566.11000000HMA:
7=105418.6800000014=101905.4500000021=101651.4000000030=103762.9000000050=104822.47000000100=109218.59000000200=113073.11000000 - 12. Funding Rate:
0.005%
- 13. Open Interest:
85498.2040
- 14. Fear & Greed Index:
29 (Fear)
Disclaimer: This market analysis is generated by AI based on historical BTC data and sentiment indicators. Use it as a reference, not financial advice.
