
Market Analysis
Bitcoin has entered a cautious and uncertain phase after failing to break past the recent peak of 124,000. Despite a reduction in the Federal Reserve’s interest rates, a prevailing sense of fear dominates the market. Price movements have remained subdued, signaling a slowdown in upward momentum.
Over the past five days, Bitcoin's price has shown a significant decline, accompanied by weakening technical indicators, which have negatively impacted market sentiment. Starting at 110,763 on October 16, the price closed lower at 108,194, followed by increased downward pressure that pushed it further down to 106,431 on October 17. The 7-day RSI consistently hovered between 25 and 29, indicating an oversold condition and suggesting a weak buying trend. Similarly, the Money Flow Index (MFI) remained below 30, pointing to a reduction in cash inflows within the market. During this period, the Fear & Greed Index stayed between 22 and 29, reinforcing the cautious mood among investors.
Bollinger Bands indicated weak volatility as prices lingered near the lower band, while Hull Moving Averages (HMAs) showed a downward trend. Both the 7- and 14-day HMAs declined steadily. Although the price briefly rose from 108,642 to 110,532 on October 20, it remained below the 14- and 21-day moving averages—an indication of insufficient strength for a bullish breakout. This suggests that Bitcoin's current price levels do not support a strong short-term uptrend.
On the fundamental side, Grant Cardone’s firm has increased its Bitcoin holdings, signaling confidence from institutional investors. However, ongoing trade tensions between the U.S. and China have heightened global market volatility, exerting downward pressure on Bitcoin’s price. Regulatory scrutiny of crypto ATMs in Australia and community criticism surrounding Binance’s BNB token have added to market uncertainty. Additionally, recent sell-offs by major Bitcoin holders have intensified short-term downward pressure.
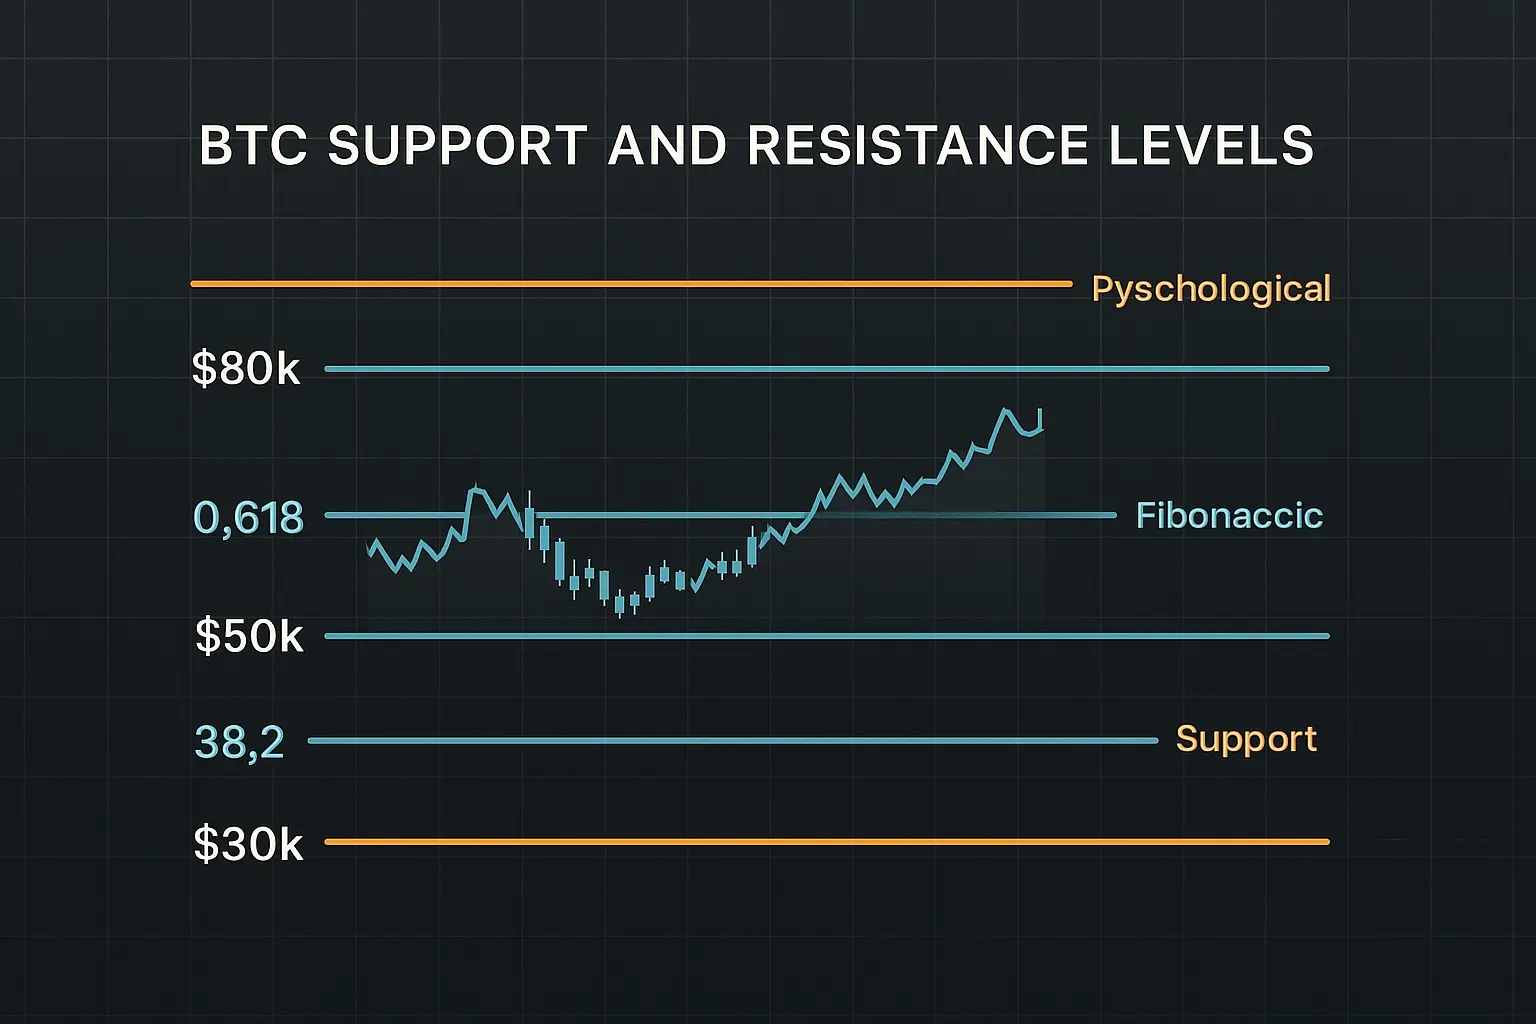
In terms of support and resistance, the key psychological support level lies near 110,000, making it a critical floor given the current price proximity. Below this, the S1 support zone ranges between 108,377 and 107,172; a breach here could lead to further declines toward the S2 range of 105,681 to 104,872. Beyond that, the S3 support level, spanning 101,508 to 99,950, would be crucial in preventing a more prolonged downturn. On the resistance side, the first major barrier (R1) lies between 111,696 and 112,371, which could challenge any immediate recovery. Further resistance levels (R2 and R3) range from 116,788 up to 121,022, presenting significant hurdles for sustained bullish momentum.
The financing rate remains close to zero, and a 1.75% drop in open interest signals declining liquidity and increasing investor caution. These factors highlight ongoing short-term pressure, especially given the Fear & Greed Index’s proximity to fear levels. Nonetheless, Bitcoin’s ability to hold near the 110,000 support level suggests that a sharp downward move is limited for now.
Overall, Bitcoin’s current technical and fundamental conditions reflect a cautious and uncertain market environment, where short-term pressure is dominant but long-term investors and institutions continue to strengthen their positions. A drop below the 110,000 mark and S1 support zone could trigger further declines, while a breakthrough above 111,696 could pave the way for renewed upward momentum. Given the prevailing market sentiment and global economic uncertainties, investors should proceed with caution and remain prepared for sudden price fluctuations.
Data Summary
- 1. Time:
2025-10-21 – 00:00 UTC - 2. Prices:
Open: 108642.77000000High: 111705.56000000Low: 107402.52000000Close: 110532.09000000
- 8. Supports:
S1: 108377.40000000 – 107172.52000000S2: 105681.14000000 – 104872.50000000S3: 101508.68000000 – 99950.77000000S4: 94881.5 – 92206
- 9. Resistances:
R1: 111696.21000000 – 112371.00000000R2: 116788.96000000 – 117543.75000000R3: 119177.56000000 – 121022.07000000
- 10. Psychological Support:
110000.00000000
- 11. Psychological Resistance:
120000.00000000
- 3. Last 5 days’ closing prices:
2025-10-16: 108194.280000002025-10-17: 106431.680000002025-10-18: 107185.010000002025-10-19: 108642.780000002025-10-20: 110532.09000000
- 4. Volume:
BTC: 19193.4416USD: $2119912185.5935
- 5. Number of trades:
4283542
- 6. Indicators:
RSI: 44.9400MFI: 30.8200BB Upper: 127663.23000000BB Lower: 103843.67000000
- 7. Moving Averages:
SMA:7=109253.8900000014=113187.3100000021=115753.4500000030=114671.1600000050=114096.86000000100=114883.33000000200=106827.17000000EMA:
7=109982.4600000014=111982.0800000021=113049.7700000030=113661.1800000050=113977.28000000100=112677.04000000200=107498.64000000HMA:
7=108903.9200000014=106443.6100000021=106038.4500000030=109901.7400000050=114679.77000000100=115328.03000000200=117896.96000000 - 12. Funding Rate:
0% (Technically Positive)
- 13. Open Interest:
80787.7270
- 14. Fear & Greed Index:
29 (Fear)
Disclaimer: This market analysis is generated by AI based on historical BTC data and sentiment indicators. Use it as a reference, not financial advice.
