
Market Analysis
Bitcoin has recently struggled to surpass the key level of 124,000, creating a sense of uncertainty within the market. Despite the Federal Reserve’s interest rate cuts, there has not been a notable increase in buying momentum, which may indicate underlying price weakness. Given this environment, investors are advised to exercise considerable caution, as the market remains vulnerable to a sudden downturn.
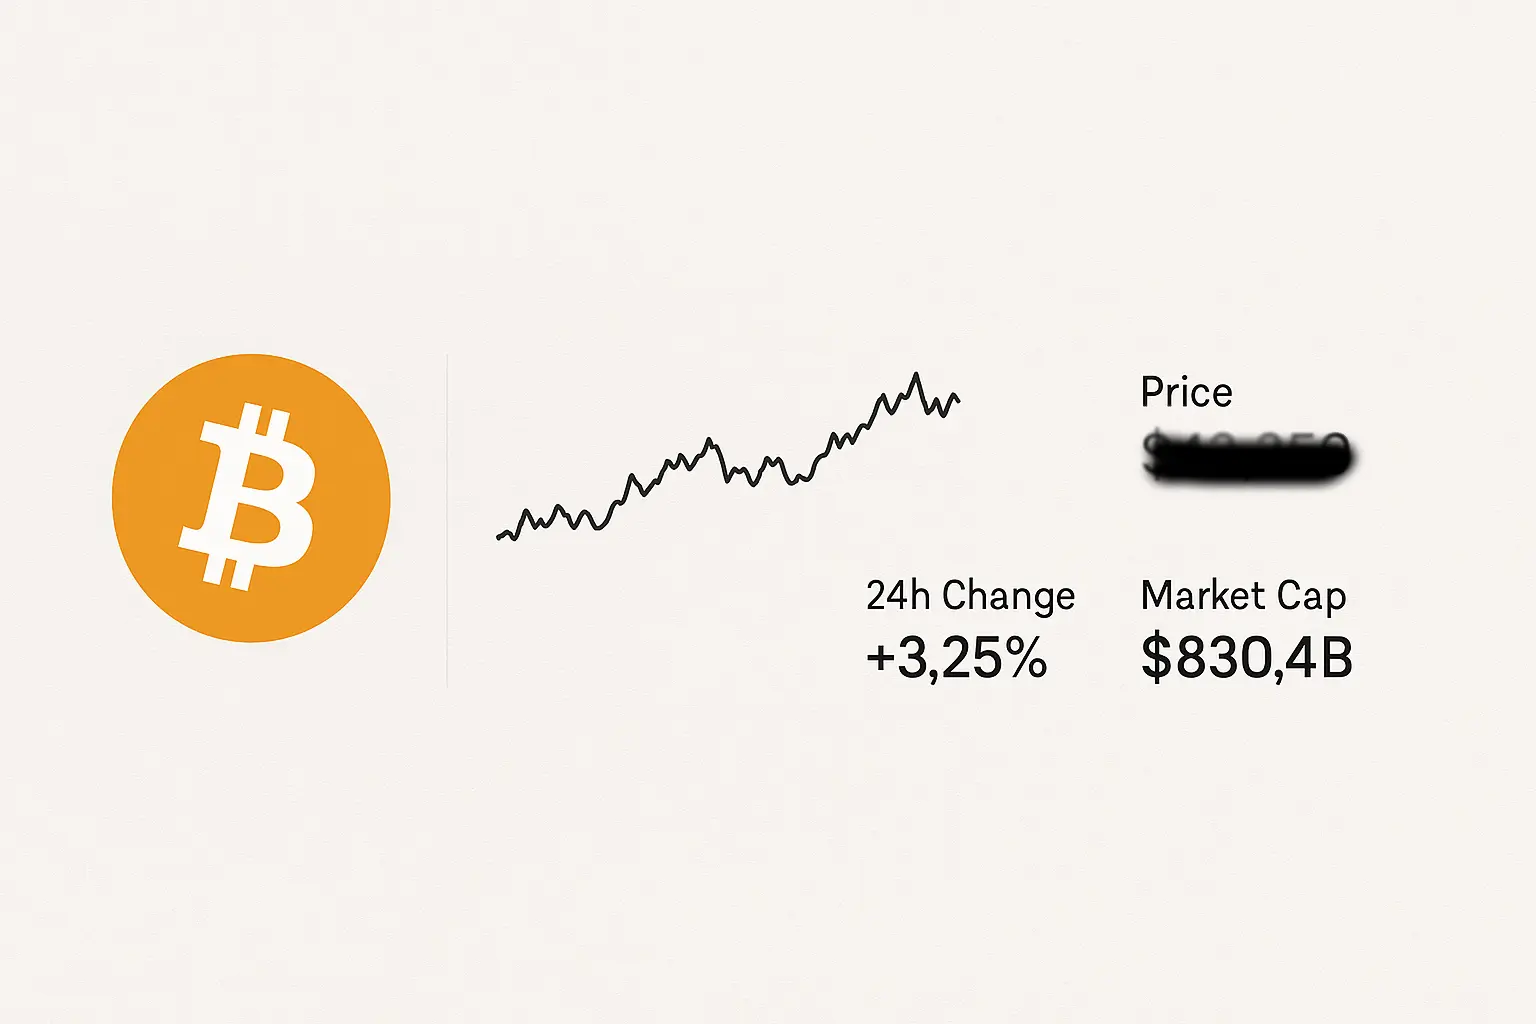
Over the past five days, Bitcoin’s price has experienced significant volatility. Starting at 113,307 on September 24th, it closed slightly lower at 112,163 on September 28th. The 7-day RSI dropped from 42.42 on September 24th to 24.64 the following day, before stabilizing around 29 on September 26th and 27th, and then rising to 48.48 by September 28th—suggesting a short-term improvement after a period of weakness. Similarly, the 14-day Money Flow Index (MFI) declined from 40.03 to 21.23, reflecting weak liquidity and subdued buying interest. The Fear and Greed Index also fell sharply from 44 to 28, highlighting prevailing market caution and apprehension.
Looking at the Bollinger Bands, prices have frequently hovered near the lower band, particularly on September 25th and 26th, signaling oversold conditions. However, by September 28th, prices made an attempt to recover toward the mid-band. Trading volume saw a notable spike on September 25th, driven by liquidation events amid a sudden price drop, whereas volumes remained low on September 27th and 28th, indicating weak market participation and diminished trading activity. The Hull Moving Averages (HMA) further reflect the uncertain outlook: the 7-day HMA stood at 110,085 on September 28th, closely followed by the 14-day HMA at 109,225, suggesting a fragile yet steady short-term trend. Meanwhile, the declining 21-day and 30-day HMAs imply mounting medium-term pressure.
In terms of key support and resistance, Bitcoin currently sits near a crucial support range between 111,998 and 110,917, which also serves as an important psychological level. Should this zone fail, the next significant support lies between 105,681 and 104,872, potentially signaling further downside risk. On the upside, resistance levels are identified between 115,685 and 116,665, and again from 116,788 to 117,543, which may pose hurdles for any price recovery. Despite the Federal Reserve’s rate cuts, investor sentiment remains cautious, contributing to increased liquidations by large holders and heightened price fluctuations.
From a broader perspective, although regulatory improvements in the U.S. digital asset sector and growing interest from new stakeholders offer some optimism, Bitcoin’s price has yet to stabilize. Reduced buying activity from major institutions and a rising number of liquidations indicate short-term pressure. Nevertheless, Bitcoin’s long-term significance and continued adoption suggest the potential for the market to soon find a new direction. Overall, the current technical and fundamental landscape emphasizes the need for a cautious approach, as the price could quickly decline but also holds the possibility for an abrupt positive shift.
Data Summary
- 1. Time:
2025-09-29 – 00:00 UTC - 2. Prices:
Open: 109635.85000000High: 112350.00000000Low: 109189.99000000Close: 112163.95000000
- 8. Supports:
S1: 111998.80000000 – 110917.45000000S2: 105681.14000000 – 104872.50000000S3: 101508.68000000 – 99950.77000000S4: 96945.6 – 90056.2
- 9. Resistances:
R1: 115685.63000000 – 116665.63000000R2: 116788.96000000 – 117543.75000000R3: 120134.08000000 – 120820.71000000
- 10. Psychological Support:
110000.00000000
- 11. Psychological Resistance:
120000.00000000
- 3. Last 5 days’ closing prices:
2025-09-24: 113307.000000002025-09-25: 108994.490000002025-09-26: 109643.460000002025-09-27: 109635.850000002025-09-28: 112163.95000000
- 4. Volume:
BTC: 7542.3316USD: $832254944.3203
- 5. Number of trades:
1484866
- 6. Indicators:
RSI: 48.4800MFI: 26.0500BB Upper: 118744.76000000BB Lower: 108957.59000000
- 7. Moving Averages:
SMA:7=111199.2200000014=113614.6200000021=113851.1700000030=112761.2200000050=113530.04000000100=112898.38000000200=103520.26000000EMA:
7=111569.6400000014=112494.5600000021=112855.7800000030=113079.9900000050=113144.33000000100=111367.35000000200=105635.48000000HMA:
7=110085.6700000014=109225.7700000021=110297.3000000030=112820.9900000050=114117.58000000100=112888.37000000200=118341.99000000 - 12. Funding Rate:
0.0053%
- 13. Open Interest:
84552.9770
- 14. Fear & Greed Index:
()
Disclaimer: This market analysis is generated by AI based on historical BTC data and sentiment indicators. Use it as a reference, not financial advice.
