
Market Analysis
This analysis examines the recent price movements of Bitcoin within the broader context of global economic and political developments. Various countries’ financial policies and investment trends have generated significant interest in the market. By closely observing institutional investor activity and underlying market sentiment, we aim to identify potential future trends.
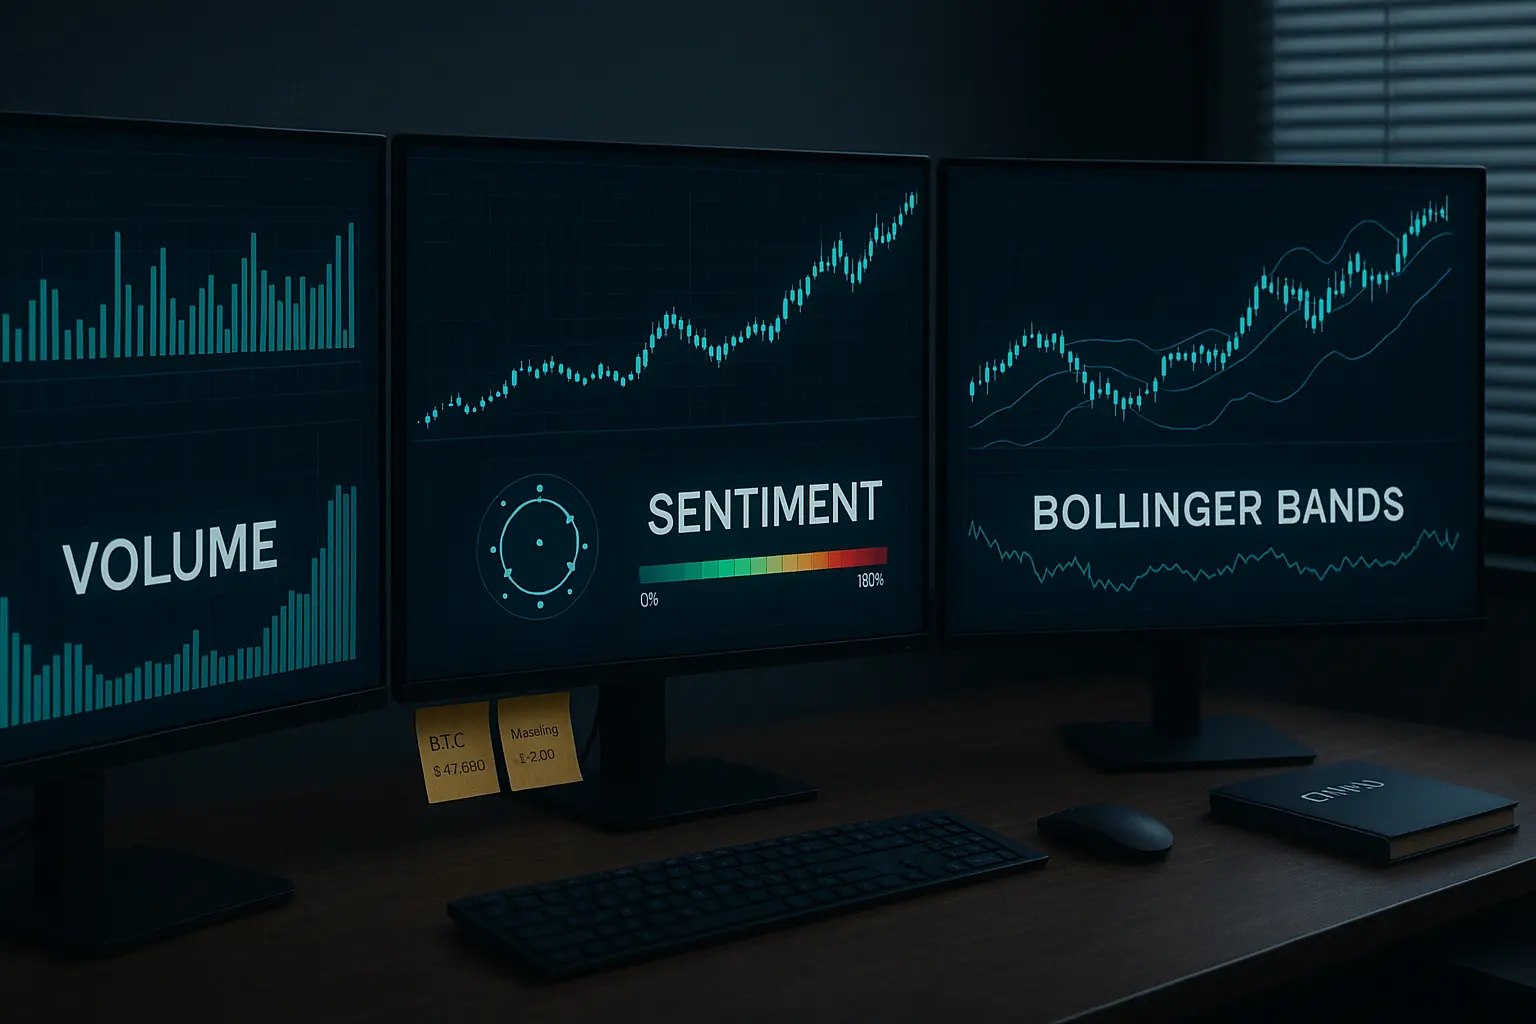
Over the past five days, Bitcoin’s price has experienced notable volatility driven largely by global financial news and shifts in investor behavior. On September 13, the price opened at 116,029 and closed slightly lower at 115,918, followed by a modest decline on September 14. However, the price regained stability and showed upward momentum on September 15 and 16, reaching a high of 116,788 on the 16th. On September 17, Bitcoin closed at 116,447, accompanied by increased trading volume and a surge in the number of trades. Technical indicators such as RSI and MFI suggest that while buying pressure remains present, it has softened in recent days, indicating a market leaning toward neutral or balanced sentiment. Bollinger Bands highlight the price hovering near the upper band, suggesting conditions approaching overbought territory.
Several key factors have influenced this stability and upward movement. Expectations of an interest rate cut by the US Federal Reserve have bolstered investor confidence. Meanwhile, initiatives like the experimental adoption of Bitcoin in a Brazilian village are viewed as positive steps toward financial autonomy. Institutional investment has further strengthened market sentiment, with firms like BlackRock and Fidelity increasing their stakes in Bitcoin ETFs. Activity from major investors and optimistic forecasts from Wall Street analysts also continue to shape market psychology. Nevertheless, lingering uncertainties in US-China trade relations and ongoing global economic pressures introduce a degree of caution among investors.
From a technical perspective, the picture points to a steady but cautious uptrend. On September 17, Bitcoin closed above all major short-term moving averages, with gains observed in the 14- and 21-day moving averages as well, signaling a robust yet measured upward trajectory. Support levels are established between 112,872 and 110,345, providing a solid safety net against downside risks. Resistance is anticipated between 119,177 and 120,998, where price breakthroughs may face challenges. The Fear and Greed Index near 52 reflects a moderate market mood, while increases in funding rates and open interest indicate sustained investor engagement.
Overall, Bitcoin’s current position suggests a balanced but cautious ascent supported by prevailing global economic conditions and institutional investment trends. However, ongoing geopolitical and economic uncertainties—particularly decisions from the Federal Reserve and developments in US-China relations—could trigger fluctuations in market sentiment. Investors are advised to monitor key support and resistance levels closely and adapt their strategies in response to evolving market sentiment and news, aiming to mitigate potential risks while capitalizing on emerging opportunities.
Data Summary
- 1. Time:
2025-09-18 – 00:00 UTC - 2. Prices:
Open: 116788.96000000High: 117286.73000000Low: 114720.81000000Close: 116447.59000000
- 8. Supports:
S1: 112872.94000000 – 112380.00000000S2: 111546.39000000 – 110345.42000000S3: 101508.68000000 – 99950.77000000S4: 96945.6 – 90056.2
- 9. Resistances:
R1: 119177.56000000 – 120998.71000000
- 10. Psychological Support:
110000.00000000
- 11. Psychological Resistance:
120000.00000000
- 3. Last 5 days’ closing prices:
2025-09-13: 115918.290000002025-09-14: 115268.010000002025-09-15: 115349.710000002025-09-16: 116788.960000002025-09-17: 116447.59000000
- 4. Volume:
BTC: 16754.2454USD: $1946083704.6217
- 5. Number of trades:
3227418
- 6. Indicators:
RSI: 69.3800MFI: 55.3100BB Upper: 118006.89000000BB Lower: 106922.88000000
- 7. Moving Averages:
SMA:7=115897.8100000014=113683.7500000021=112464.8800000030=112680.3900000050=114283.18000000100=112168.32000000200=102126.00000000EMA:
7=115511.4800000014=114402.2500000021=113937.6400000030=113758.5400000050=113427.98000000100=111022.32000000200=104797.77000000HMA:
7=116581.9700000014=117089.2600000021=116991.5700000030=115422.9100000050=112173.60000000100=113204.73000000200=118687.78000000 - 12. Funding Rate:
0.0063%
- 13. Open Interest:
90738.3180
- 14. Fear & Greed Index:
53 (Neutral)
Disclaimer: This market analysis is generated by AI based on historical BTC data and sentiment indicators. Use it as a reference, not financial advice.
