
Market Analysis
Bitcoin’s price has exhibited active yet uncertain movements over the past few days amid the broader cryptocurrency landscape, influenced heavily by global economic conditions and shifts in U.S. monetary policies. Today’s detailed analysis examines current market sentiment, key news developments, and technical indicators to assess the potential directions Bitcoin’s price may take going forward.
Reviewing data and news from the past five days, Bitcoin’s price has experienced modest fluctuations, reflecting cautious investor behavior amid a complex global financial environment. On September 5th, Bitcoin opened at 110,730 and climbed to a daily high of 113,384 before closing slightly lower at 110,659, indicating a mild pullback. The Relative Strength Index (RSI) on a 7-day basis stood at 46.22, positioned within a neutral zone and signaling neither strong bullish nor bearish momentum. Similarly, the 14-day Money Flow Index (MFI) registered 50.74, pointing to balanced liquidity and a stable market condition. On September 6th, a slight drop in price accompanied by a noticeable decrease in trading volume suggested temporary investor caution.
Subsequently, on September 8th and 9th, Bitcoin showed some recovery. The price rose from 111,137 to 112,065 on the 8th, with the RSI climbing to 56.52 and the MFI reaching 63.52, reflecting moderate market strength. However, a minor decline followed on the 9th, closing at 111,546, indicating continued volatility. Bollinger Bands analysis reveals that prices remained close to the midline throughout this period, suggesting a lack of significant breakout and a consolidation within a narrow trading range. Additionally, the moving averages corroborate the absence of a strong upward or downward trend, instead hinting at a gentle upward bias, particularly evident between the 7-day and 14-day moving averages.
From a fundamental perspective, expectations of potential interest rate cuts by the U.S. Federal Reserve and weaker-than-anticipated U.S. employment data have exerted a positive influence on Bitcoin’s price. A Bank of America report anticipates two rate reductions in 2025, offering optimism to investors. Furthermore, growing adoption of stablecoins and Tether’s gold-backed investments have contributed to enhanced market stability. Nonetheless, cautious sentiment persists due to ongoing uncertainty in the global financial environment and fragile U.S. job reports. The Fear & Greed Index hovering near 48 reflects neither excessive fear nor greed, implying a balanced market psychology. Meanwhile, a 2.65% increase in open interest and a positive funding rate indicate continued—but measured—investment interest.
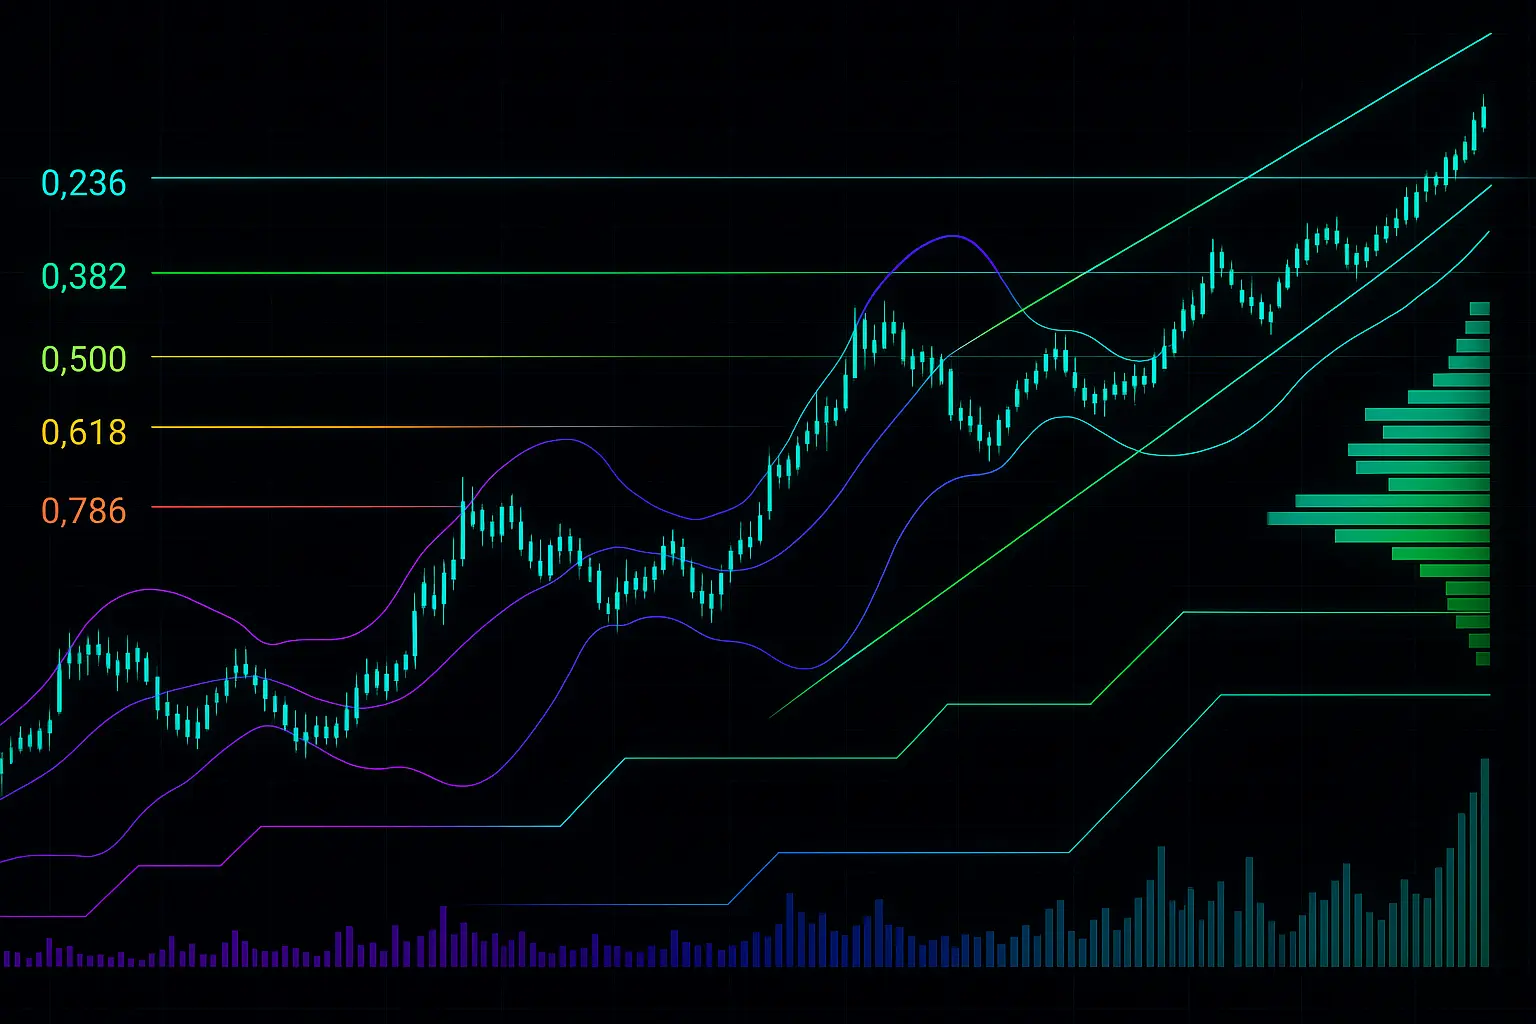
Technically, the psychological support level around 110,000 appears robust, while the resistance zone between 111,696 and 112,371 is currently limiting upward movement. Should this range be breached, the next key resistance lies between 116,935 and 117,944, which could pave the way for further price gains. On the downside, support levels to watch are between 108,377 and 107,172, followed by a lower band from 105,681 to 104,872. The market currently shows no clear breakout, and price action remains largely dependent on developments in global monetary policies and indicators from the U.S. economy.
Overall, Bitcoin’s recent price behavior has been moderate with an undercurrent of uncertainty, strongly influenced by potential shifts in financial policies and economic vulnerabilities in the United States. No definitive bullish or bearish trend has yet emerged, with prices consolidating within a narrow range as investors adopt a cautious stance. Should the Federal Reserve move forward with interest rate cuts, Bitcoin could benefit from favorable conditions. However, persistent global financial uncertainties and other risk factors may continue to apply downward pressure. Investors are advised to closely monitor news and market sentiment, exercising patience to make well-informed decisions.
Data Summary
- 1. Time:
2025-09-10 – 00:00 UTC - 2. Prices:
Open: 112065.23000000High: 113293.29000000Low: 110766.66000000Close: 111546.39000000
- 8. Supports:
S1: 108377.40000000 – 107172.52000000S2: 105681.14000000 – 104872.50000000S3: 101508.68000000 – 99950.77000000S4: 96444.7 – 95217.4
- 9. Resistances:
R1: 111696.21000000 – 112371.00000000R2: 116935.99000000 – 117944.05000000R3: 119415.55000000 – 120324.43000000
- 10. Psychological Support:
110000.00000000
- 11. Psychological Resistance:
120000.00000000
- 3. Last 5 days’ closing prices:
2025-09-05: 110659.990000002025-09-06: 110187.970000002025-09-07: 111137.340000002025-09-08: 112065.230000002025-09-09: 111546.39000000
- 4. Volume:
BTC: 15379.2825USD: $1721465997.9064
- 5. Number of trades:
2143242
- 6. Indicators:
RSI: 52.3200MFI: 64.5400BB Upper: 115838.71000000BB Lower: 107236.91000000
- 7. Moving Averages:
SMA:7=111147.6400000014=110555.7100000021=111537.8100000030=113170.3100000050=114711.08000000100=111351.11000000200=101334.50000000EMA:
7=111166.6500000014=111329.3900000021=111832.2700000030=112359.9300000050=112567.92000000100=110213.79000000200=103892.35000000HMA:
7=111957.5300000014=111570.7100000021=110694.1600000030=109325.5000000050=109554.71000000100=114142.24000000200=119066.81000000 - 12. Funding Rate:
0.01%
- 13. Open Interest:
91251.6880
- 14. Fear & Greed Index:
48 (Neutral)
Disclaimer: This market analysis is generated by AI based on historical BTC data and sentiment indicators. Use it as a reference, not financial advice.
