
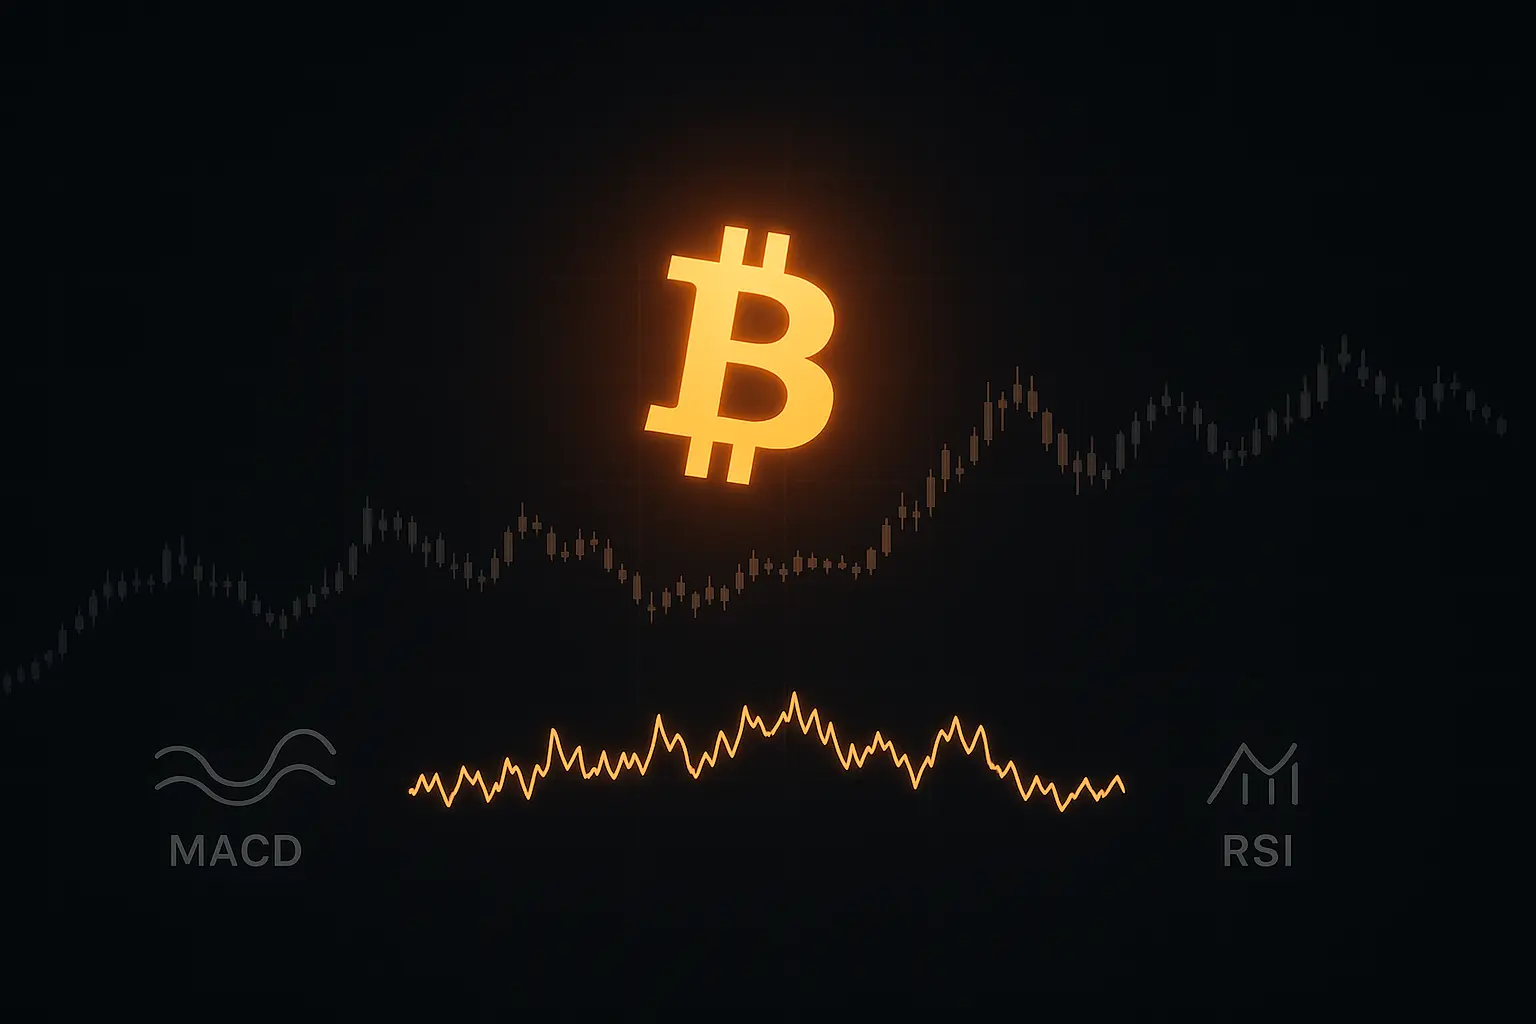
Market Analysis
Bitcoin's price in the cryptocurrency market has demonstrated notable volatility in recent days, influenced primarily by global economic conditions and the strategies adopted by major investors. This analysis aims to explore these underlying factors in depth to provide a clearer understanding of the current market dynamics and potential future developments.
Over the past five days, Bitcoin has experienced significant price fluctuations driven by shifts in global financial news and changing investor sentiment within the crypto space. On August 19, Bitcoin’s price dropped sharply from 116,227 to close at 112,872. Technical indicators such as the RSI at 33.84 and MFI at 50.44 suggested a weak but not fully bearish momentum. The Fear & Greed Index registered 56 on the same day, indicating moderate greed within the market. The following day saw a modest recovery, with the price rising to 114,271; however, this rebound was limited due to declining volume and reduced trading activity.
Recent reports reveal increased interest from large investment firms in Ethereum and Bitcoin, with SharpLink Gaming notably making significant Ethereum purchases—a signal of growing confidence in the market. Nonetheless, fluctuations in the price of Ethereum alongside a decline in Binance’s BNB token have contributed to overall uncertainty across the crypto market. Additionally, a mixed performance in the U.S. stock market, particularly the decline in Nasdaq, has exerted downward pressure on cryptocurrencies, prompting a cautious stance among investors.
On August 22, Bitcoin saw a sharp upward movement, climbing from 111,684 to 116,935, indicating a strong uptrend. On this day, the RSI rose to 54.16 and MFI to 56.47, reflecting positive momentum. The price closing near the midline of the Bollinger Bands suggested the formation of a stable support level. However, on August 23, a slight pullback occurred with the price closing at 115,438. The Fear & Greed Index increased to 60, signifying rising greed, which may foreshadow a short-term correction.
An examination of moving averages showed Bitcoin closed above its 7-day moving average on August 22, reinforcing the strength of the upward trend. Although the price dipped slightly on August 23, it remained close to this moving average, indicating a cautiously positive outlook. Support levels appear robust between 112,872 and 112,380, 108,262 and 107,172, and between 101,508 and 99,950. Resistance zones are identified between 116,935 and 117,944, as well as from 119,841 to 123,218. A break below 112,380 could shift momentum toward the next support at 108,262, while surpassing 117,944 may open the way toward resistance at 119,841.
Modest positive financing rates alongside a decline in open interest suggest a mild reduction in trading enthusiasm, reflecting a cautious approach by investors. The past five days of market activity highlight how global financial developments—particularly decisions by the U.S. Federal Reserve and fluctuations in the stock market—continue to influence Bitcoin’s price trajectory. Meanwhile, sustained interest from large institutional investors in Bitcoin and other crypto assets points to potential long-term market resilience.
In summary, Bitcoin’s price has recently exhibited dynamic but measured behavior, with global economic news and investor sentiment playing critical roles in price direction. While a short-term correction may be expected amid increasing market greed, strong support levels and continued institutional involvement provide grounds for optimism over the longer term. Investors are advised to remain vigilant and closely monitor shifts in global economic conditions as they navigate this evolving market landscape.
Data Summary
- 1. Time:
2025-08-24 – 00:00 UTC - 2. Prices:
Open: 116936.00000000High: 117030.00000000Low: 114560.00000000Close: 115438.05000000
- 8. Supports:
S1: 112872.94000000 – 112380.00000000S2: 108262.94000000 – 107172.52000000S3: 101508.68000000 – 99950.77000000S4: 96945.6 – 90056.2
- 9. Resistances:
R1: 116935.99000000 – 117944.05000000R2: 119841.18000000 – 123218.00000000
- 10. Psychological Support:
110000.00000000
- 11. Psychological Resistance:
120000.00000000
- 3. Last 5 days’ closing prices:
2025-08-19: 112872.940000002025-08-20: 114271.240000002025-08-21: 112500.000000002025-08-22: 116935.990000002025-08-23: 115438.05000000
- 4. Volume:
BTC: 11329.3620USD: $1308825428.0144
- 5. Number of trades:
1559569
- 6. Indicators:
RSI: 48.6000MFI: 56.8200BB Upper: 120184.42000000BB Lower: 111506.41000000
- 7. Moving Averages:
SMA:7=115482.7600000014=116149.3100000021=115845.4100000030=116582.0900000050=115274.94000000100=110595.13000000200=100225.33000000EMA:
7=115482.0400000014=115821.1400000021=115898.0400000030=115648.9300000050=114308.98000000100=109987.08000000200=102617.38000000HMA:
7=115546.3900000014=114166.9800000021=115574.7700000030=115821.9000000050=116041.88000000100=119581.00000000200=120216.56000000 - 12. Funding Rate:
0.0097%
- 13. Open Interest:
88577.4700
- 14. Fear & Greed Index:
60 (Greed)
Disclaimer: This market analysis is generated by AI based on historical BTC data and sentiment indicators. Use it as a reference, not financial advice.
