
Market Analysis
This analysis aims to explore the recent fluctuations in Bitcoin’s price by examining the broader global economic landscape alongside developments within the cryptocurrency market. Our focus is on understanding the underlying market sentiment and news dynamics, deliberately setting aside technical indicators, to provide a comprehensive view of current trends and investor behavior.
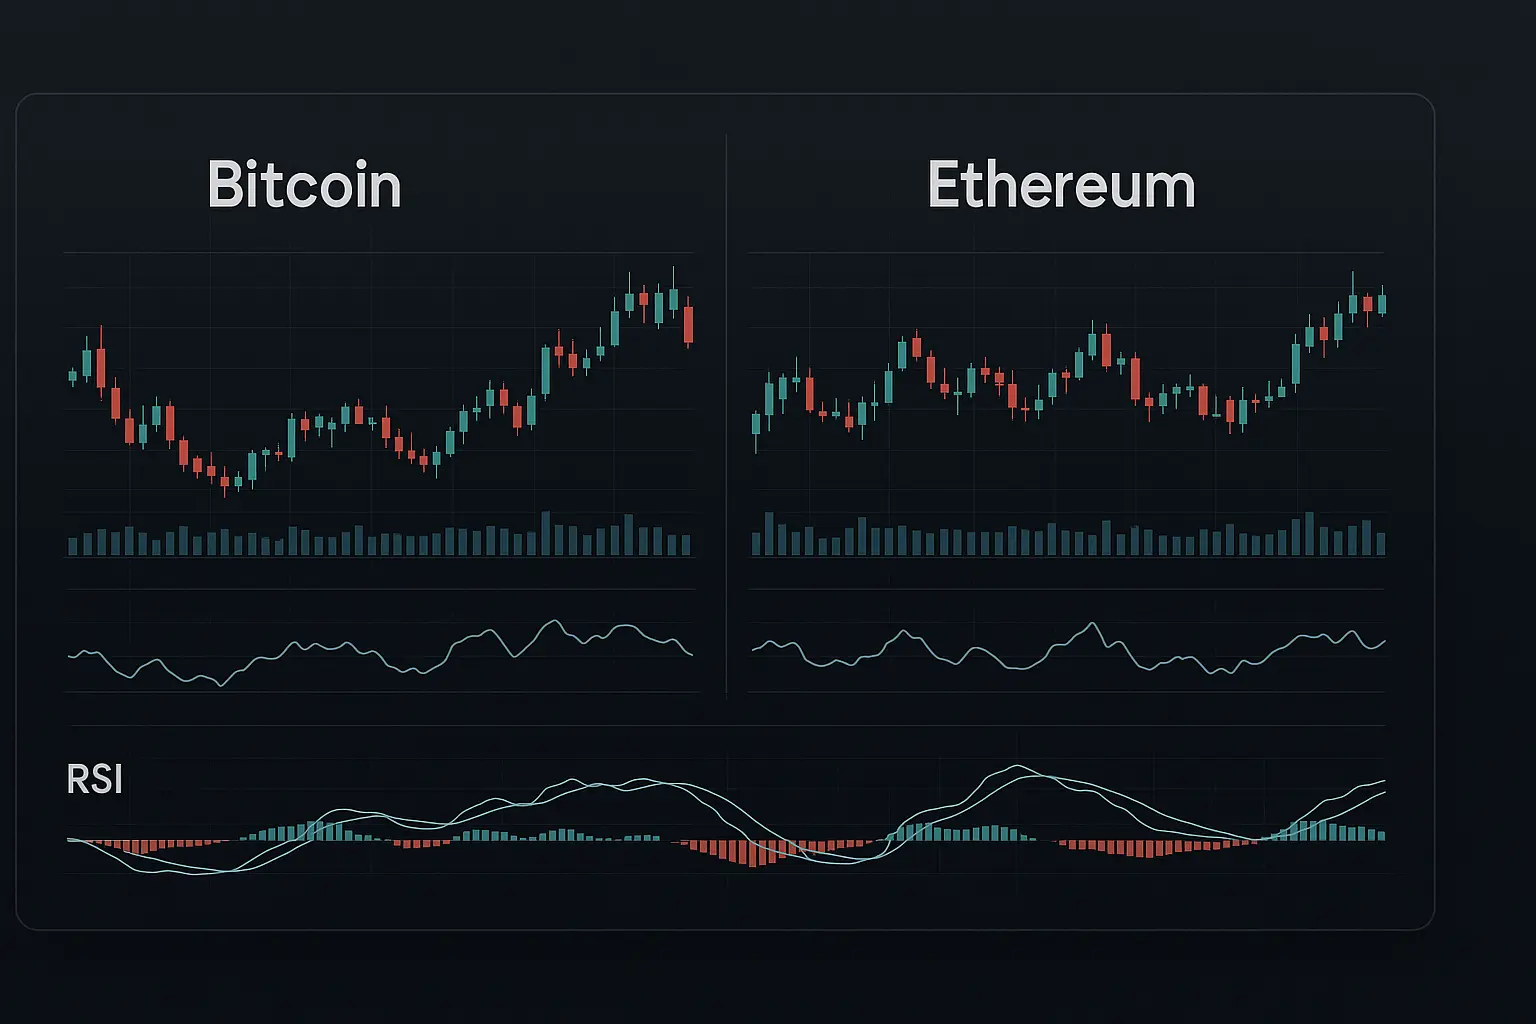
Over the past five days, Bitcoin has experienced significant volatility driven largely by uncertainties in global financial markets and specific cryptocurrency-related news. On August 10th, Bitcoin reached a peak of 119,294 USDT, followed by a decline and a partial recovery in the subsequent days. The Relative Strength Index (RSI) fell from 67 to 33, indicating a shift from initial market strength to weakening momentum. Meanwhile, the Money Flow Index (MFI) oscillated between 40 and 50, reflecting a moderate equilibrium in capital movement. The Fear and Greed Index declined from 69 to 56, signaling growing caution among investors. During this period, Bitcoin’s price dipped to 112,872 USDT, approaching key support levels, suggesting increased selling pressure but without a clear bearish trend emerging.
From a news perspective, SharpLink Gaming’s substantial purchase of Ethereum has sparked renewed interest in the crypto space. However, Ethereum’s 2.7% price drop, along with weak performance in Binance’s BNB token, has kept overall market sentiment uncertain. The U.S. stock market’s mixed signals—Dow Jones hitting record highs while Nasdaq experiences declines—highlight broader financial market volatility that is also impacting cryptocurrencies. Additionally, SkyBridge Capital’s initiative to tokenize assets on the Avalanche blockchain underscores the long-term potential of the crypto sector, although investor caution remains pronounced. Heightened concerns over Bitcoin’s privacy, especially amid increased scrutiny from major financial institutions, have contributed to a degree of mistrust within the market.
Technical observations reveal that Bitcoin’s price recently touched the lower Bollinger Band at 112,146 USDT, marking a significant support zone. The expanding width of these bands points to heightened market volatility. Regarding moving averages, the 7-day Hull Moving Average (HMA) has hovered near or below the current price, while the 14- and 21-day HMAs remain relatively stable, suggesting a mixed outlook. Although the price has slipped below the 200-day HMA—indicative of long-term pressure—the proximity to the 50- and 100-day HMAs offers some mid-term stability. The price nearing the first support range of 112,546–108,262 USDT could be pivotal; a breakdown here might lead to a test of the next support zone between 105,681 and 104,872 USDT, signaling further downside risk. Resistance levels at 115,055–116,052 USDT and 119,177–120,998 USDT may prompt price rebounds, especially if the Fear and Greed Index continues to ease.
A decline in funding rates and open interest further reflects cautious investor sentiment, suggesting that market participants are reluctant to take on heightened short-term risk. In summary, the interplay of global economic uncertainties, crypto-specific developments, and technical factors has placed Bitcoin’s price in a state of ambiguity and indecision. While certain positive news and support levels could help stabilize the price, the current subdued investor sentiment and reduced trading volumes indicate a wait-and-see approach. As such, short-term price fluctuations are likely to persist, though mid-term prospects for recovery depend on the preservation of support zones and improvements in global financial conditions.
Data Summary
- 1. Time:
2025-08-20 – 00:00 UTC - 2. Prices:
Open: 116227.05000000High: 116725.69000000Low: 112732.58000000Close: 112872.94000000
- 8. Supports:
S1: 112546.35000000 – 108262.94000000S2: 105681.14000000 – 104872.50000000S3: 101508.68000000 – 99950.77000000S4: 96945.6 – 90056.2
- 9. Resistances:
R1: 115055.03000000 – 116052.00000000R2: 119177.56000000 – 120998.71000000
- 10. Psychological Support:
110000.00000000
- 11. Psychological Resistance:
120000.00000000
- 3. Last 5 days’ closing prices:
2025-08-10: 119294.010000002025-08-11: 118686.000000002025-08-12: 120134.080000002025-08-18: 116227.050000002025-08-19: 112872.94000000
- 4. Volume:
BTC: 18065.4742USD: $2065010895.8585
- 5. Number of trades:
3291182
- 6. Indicators:
RSI: 33.8400MFI: 50.4400BB Upper: 120864.71000000BB Lower: 112146.77000000
- 7. Moving Averages:
SMA:7=117193.0100000014=115860.9400000021=116505.7400000030=117063.0100000050=114685.01000000100=110084.41000000200=99988.97000000EMA:
7=116384.1400000014=116511.3300000021=116370.1300000030=115892.4200000050=114219.25000000100=109585.69000000200=102120.34000000HMA:
7=115014.0700000014=118208.0200000021=117950.9100000030=116436.4800000050=117098.44000000100=119580.16000000200=119821.82000000 - 12. Funding Rate:
0.0032% (Technically Positive)
- 13. Open Interest:
87486.3420
- 14. Fear & Greed Index:
56 (Greed)
Disclaimer: This market analysis is generated by AI based on historical BTC data and sentiment indicators. Use it as a reference, not financial advice.
