
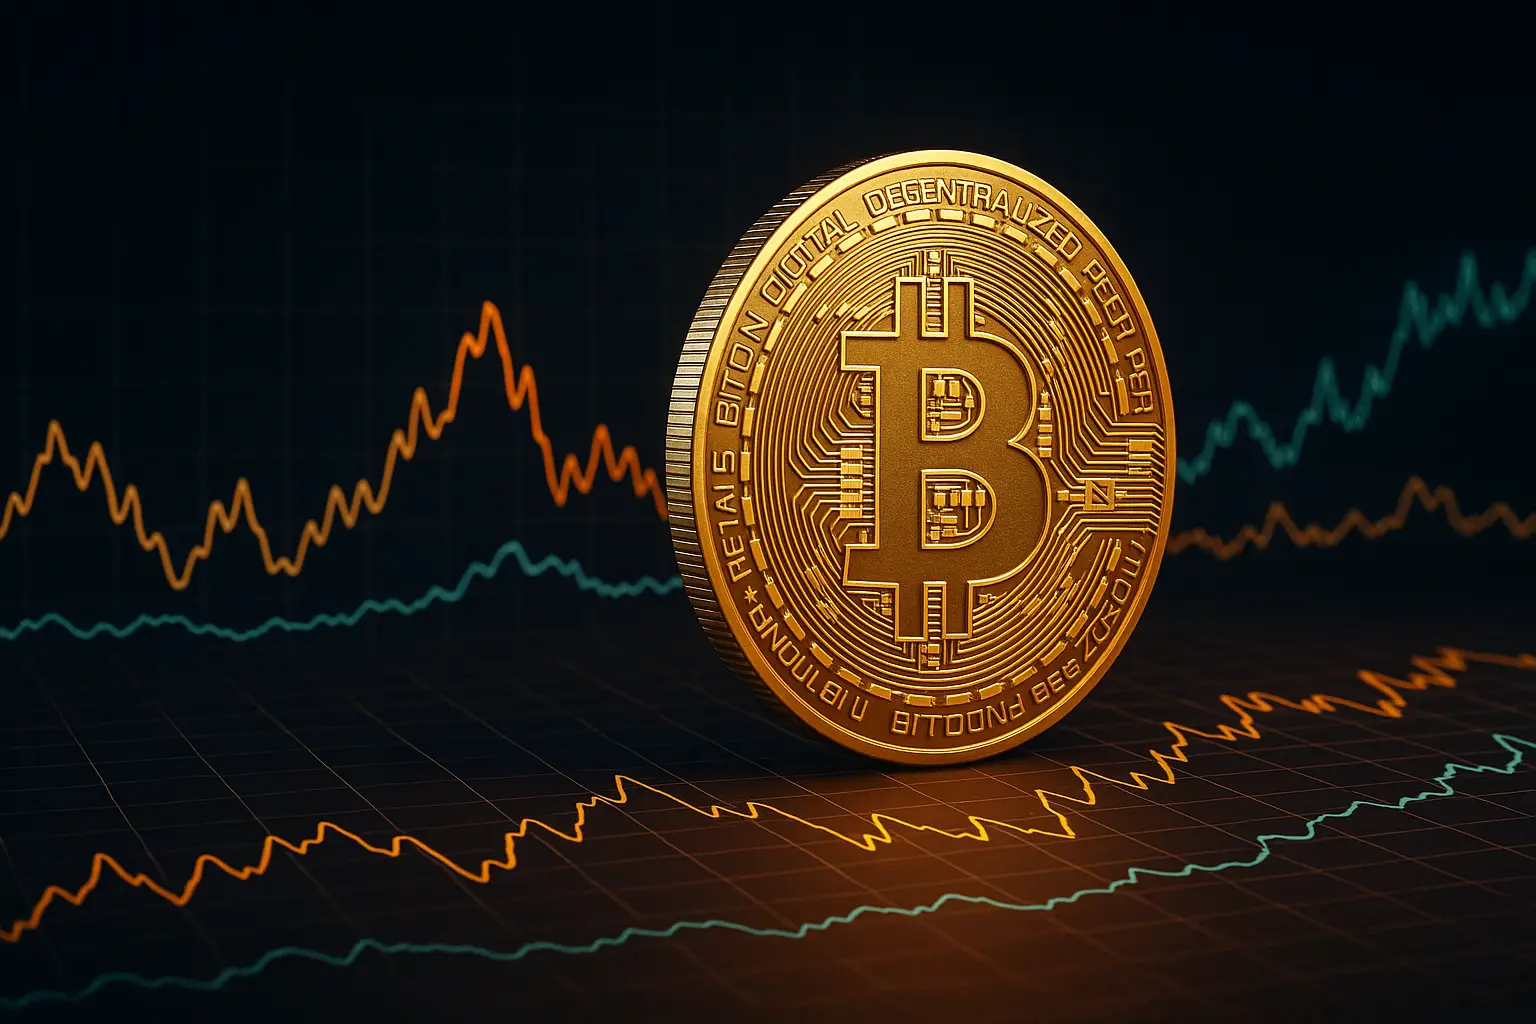
Market Analysis
This analysis examines the recent fluctuations in Bitcoin’s price and the prevailing market sentiment, set against a backdrop of global developments and investment trends that have created a complex environment. By considering various technical indicators alongside market emotions, we aim to shed light on the possible directions Bitcoin’s price may take.
Over the past five days, Bitcoin has experienced notable volatility driven largely by shifts in global financial news and market sentiment. On August 9, the price opened at 116,674 and briefly rose to a high of 117,944 before closing at 116,462, indicating limited buying strength early in the day. The Relative Strength Index (RSI) stood at 53.55, reflecting moderate momentum, while the Money Flow Index (MFI) was at 38.71, signaling a weak capital inflow. The Fear and Greed Index registered 67, suggesting a moderate level of greed in the market. Despite these indicators, both trading volume and transaction numbers remained relatively low, pointing to a lack of full market conviction.
On August 10, Bitcoin saw a sudden price surge, reaching a peak of 119,311, signaling a robust upward trend. The RSI climbed to 67, indicating increased buying power, and the MFI improved slightly to 40.39, reflecting a mild enhancement in capital flow. Trading volumes also rose, evidencing growing buyer interest. The Fear and Greed Index moved up to 69, highlighting a heightened sense of greed among investors. Positive signals from global news, including U.S. President Trump’s economic policies and encouraging developments in trade relations with China, boosted investor confidence.
Despite some fluctuations on August 11 and 12, the overall trend remained strong, with prices rising from 118,686 to 120,134. The RSI increased from 62.94 to 69.07, demonstrating sustained buying pressure, while the MFI held steady around 51, indicating balanced capital flow. Market activity intensified as volume and trades increased. The Fear and Greed Index hovered near 70, pointing to elevated greed, albeit just below extreme levels, which could trigger short-term selling pressures. News during this period remained positive, particularly regarding increased investment in the technology sector and wider acceptance of Bitcoin.
However, on August 18, the price dropped to close at 116,227, below the recent highs. The RSI fell to 45.44, signaling weakening momentum, while the MFI remained stable at 50.61, suggesting steady financial flow. The Fear and Greed Index declined to 60, indicating reduced greed and a hint of fear creeping into the market. Increased volume and trade activity hinted at mounting downward pressure. On the global front, indications of potential interest rate hikes by the U.S. and European central banks posed challenges for the cryptocurrency market.
From a technical perspective, Bitcoin’s price often gravitated near the middle Bollinger Band, reflecting uncertainty. On August 12, the price touched the upper band, indicating temporary strength, but by August 18 it closed near the lower band, suggesting possible downward pressure. The Hull Moving Averages confirmed this shift: until August 12, the averages trended upward, but by August 18, they began converging and declining, pointing toward a weakening short-term uptrend.
Key support levels lie between 114,129 and 108,262, forming a critical zone to defend against further declines. Below this, a secondary support range between 101,508 and 99,950 would come into play if the price falls further. On the resistance side, the range between 119,177 and 120,998 is crucial, with the psychological level of 120,000 representing a significant barrier. Breaking above this resistance could open the way to new highs, while failure to do so may result in a downward correction.
Overall, Bitcoin’s current state is characterized by uncertainty and mixed signals. While recent positive news and increased buyer activity have pushed prices higher, rising pressure and a declining Fear and Greed Index underscore the need for caution. Both technical and emotional factors suggest continued short-term volatility, emphasizing the growing importance of support and resistance levels in the medium term. Investors are advised to monitor developments closely and avoid hasty decisions.
Data Summary
- 1. Time:
2025-08-19 – 00:00 UTC - 2. Prices:
Open: 117405.01000000High: 117543.75000000Low: 114640.14000000Close: 116227.05000000
- 8. Supports:
S1: 114129.75000000 – 108262.94000000S2: 101508.68000000 – 99950.77000000S3: 96945.6 – 90056.2
- 9. Resistances:
R1: 119177.56000000 – 120998.71000000
- 10. Psychological Support:
110000.00000000
- 11. Psychological Resistance:
120000.00000000
- 3. Last 5 days’ closing prices:
2025-08-09: 116462.250000002025-08-10: 119294.010000002025-08-11: 118686.000000002025-08-12: 120134.080000002025-08-18: 116227.05000000
- 4. Volume:
BTC: 17745.9395USD: $2053814085.4718
- 5. Number of trades:
3346280
- 6. Indicators:
RSI: 45.4400MFI: 50.6100BB Upper: 120871.88000000BB Lower: 112660.37000000
- 7. Moving Averages:
SMA:7=117850.0200000014=116067.4500000021=116766.1200000030=117225.8500000050=114574.36000000100=109924.02000000200=99937.71000000EMA:
7=117554.5300000014=117071.0900000021=116719.8500000030=116100.6600000050=114274.21000000100=109519.29000000200=102012.28000000HMA:
7=118762.8500000014=119297.1500000021=118084.7900000030=116328.1600000050=117242.75000000100=119486.08000000200=119689.40000000 - 12. Funding Rate:
0% (Technically Positive)
- 13. Open Interest:
89560.0720
- 14. Fear & Greed Index:
60 (Greed)
Disclaimer: This market analysis is generated by AI based on historical BTC data and sentiment indicators. Use it as a reference, not financial advice.
