
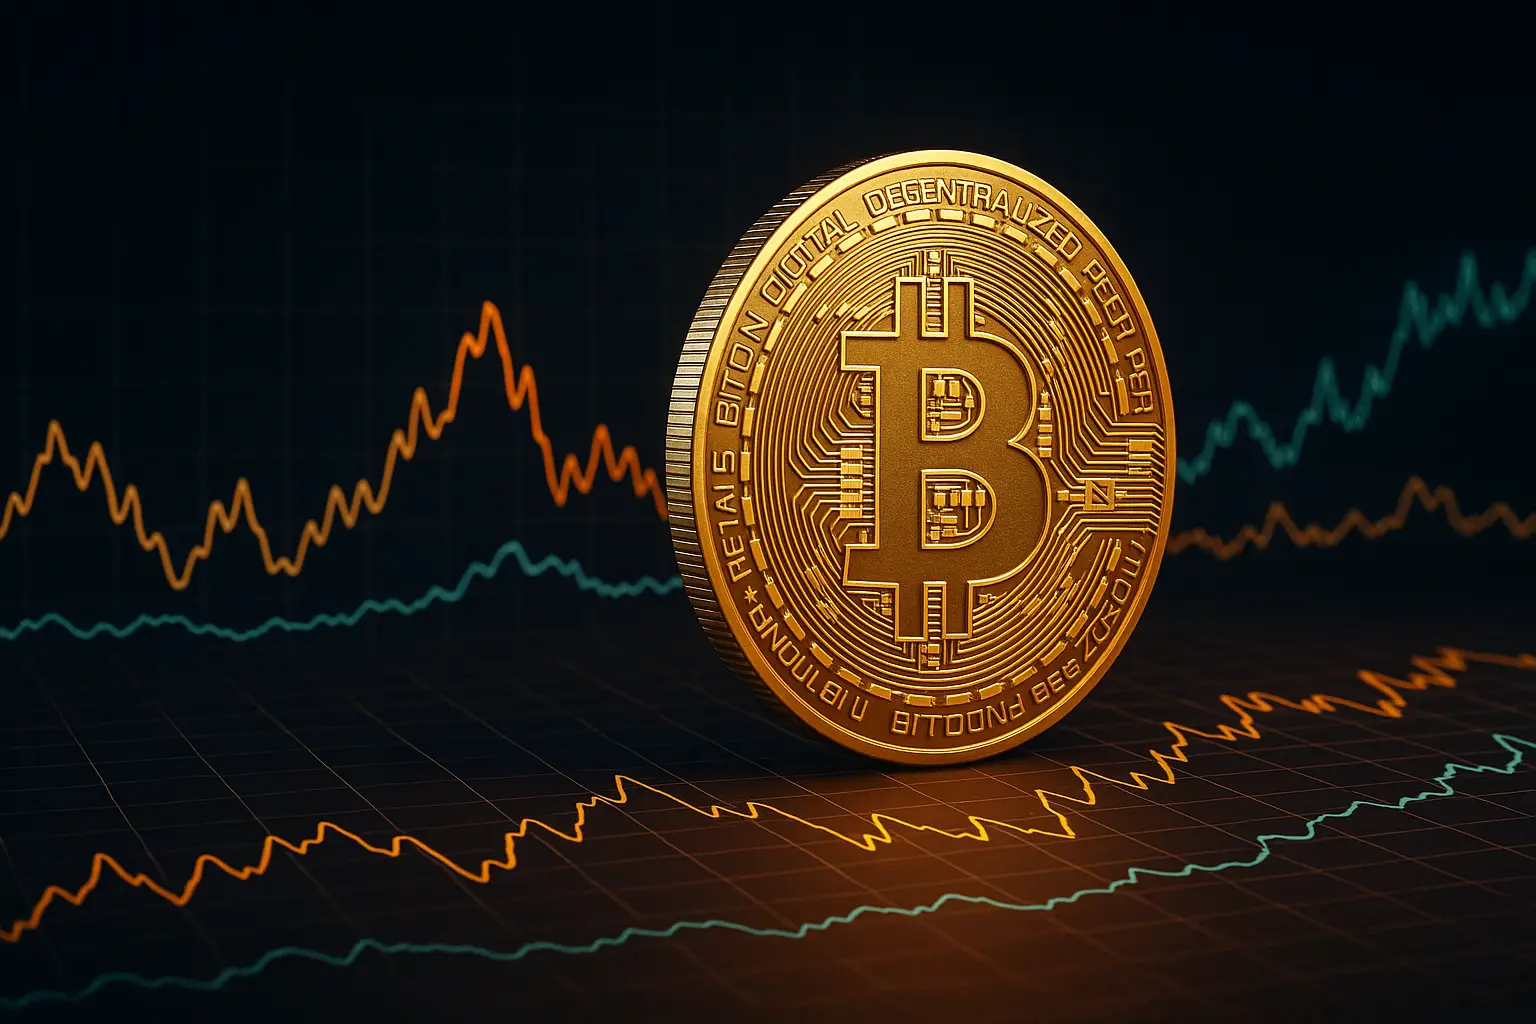
Market Analysis
Bitcoin’s price in the cryptocurrency market has shown notable volatility in recent days, largely influenced by shifting global political and economic dynamics that have significantly affected investor sentiment. This analysis delves into the key factors shaping Bitcoin’s price movements and broader market trends.
Over the past five days, despite some fluctuations, Bitcoin’s overall trend has remained relatively stable. The price opened at approximately 113,297 on August 2nd and closed near 114,992 on August 6th, reflecting a modest upward movement. The Relative Strength Index (RSI) rose from 22.23 to 45.88, indicating a transition from an oversold condition toward moderate buying strength. Meanwhile, the Money Flow Index (MFI) declined from 23.5 to 15.73, suggesting reduced capital inflow and weaker purchasing activity. The Fear and Greed Index fluctuated between 54 and 64, pointing to balanced market sentiment without excessive fear or greed, which could help maintain price equilibrium.
Looking at technical indicators, Bollinger Bands show that Bitcoin faced downward pressure while hovering near the lower band in recent days, but has now moved closer to the middle band, signaling greater price stability. Typically, a move above the lower band is seen as a positive development. The data from moving averages reveals that despite minor differences between the 7-day and 14-day averages, Bitcoin has mostly closed above the 7-day average, indicating a cautious but positive trend. However, the narrowing gap among the 21-, 30-, and 50-day moving averages suggests some near-term uncertainty regarding the price direction.
From a macroeconomic perspective, ongoing US trade tensions and policy shifts under the previous administration have injected uncertainty into the market, impacting Bitcoin as well. Rising tariffs and weak employment statistics have made investors more cautious. Additionally, increased short positions and liquidation reports from major players in Bitcoin’s futures market point toward bearish sentiment. Nonetheless, some Wall Street analysts believe this pressure may be temporary, anticipating a rebound as prominent investors like Michael Saylor continue to accumulate Bitcoin. Given these mixed signals, a prudent approach is advisable in the current environment.
Overall, Bitcoin has managed to hover near the 114,000 level despite recent volatility. Support zones between approximately 108,262 and 114,129 (S1), and 106,356 to 107,318 (S2), could prove critical in the short term, while resistance around 115,055 to 116,052 (R1) presents a significant hurdle. A sustained break above R1 could open the way to targets between 119,000 and 121,000, contingent on stronger market sentiment and trading volume. The moderate Fear and Greed Index readings and fluctuating volumes suggest short-term price indecision, but the long-term fundamentals remain sound. Investors should closely monitor news developments and global economic trends to make informed decisions.
Data Summary
- 1. Time:
2025-08-07 – 00:00 UTC - 2. Prices:
Open: 114129.75000000High: 115716.00000000Low: 113355.13000000Close: 114992.27000000
- 8. Supports:
S1: 114129.75000000 – 108262.94000000S2: 107318.30000000 – 106356.76000000S3: 101508.68000000 – 99950.77000000S4: 96945.6 – 90056.2
- 9. Resistances:
R1: 115055.03000000 – 116052.00000000R2: 119177.56000000 – 120998.71000000
- 10. Psychological Support:
110000.00000000
- 11. Psychological Resistance:
120000.00000000
- 3. Last 5 days’ closing prices:
2025-08-02: 112546.350000002025-08-03: 114208.800000002025-08-04: 115055.030000002025-08-05: 114129.750000002025-08-06: 114992.27000000
- 4. Volume:
BTC: 9761.1532USD: $1118028732.8589
- 5. Number of trades:
2026500
- 6. Indicators:
RSI: 45.8800MFI: 20.7800BB Upper: 121036.40000000BB Lower: 112814.72000000
- 7. Moving Averages:
SMA:7=114284.8900000014=116224.1700000021=116925.5600000030=116728.9200000050=112622.24000000100=108341.26000000200=99447.81000000EMA:
7=114916.7800000014=115581.4000000021=115587.7300000030=115032.1800000050=113109.14000000100=108265.09000000200=100863.35000000HMA:
7=114928.3700000014=113227.4700000021=113583.1100000030=114917.5700000050=118671.73000000100=118602.26000000200=118620.19000000 - 12. Funding Rate:
0.0083%
- 13. Open Interest:
83848.5310
- 14. Fear & Greed Index:
54 (Neutral)
Disclaimer: This market analysis is generated by AI based on historical BTC data and sentiment indicators. Use it as a reference, not financial advice.
