
Market Analysis
**Introduction:**
Bitcoin has once again broken through its previous price barriers, setting new records and injecting fresh momentum and trading activity into the market. Against this backdrop, a complex and dynamic interplay of global economic conditions, government policies, and investor sentiment is shaping the direction of the cryptocurrency market.
**Analysis:**
Over the past five days, Bitcoin’s price has experienced significant volatility, fluctuating between approximately 116,128 and 120,820. During this period, key technical indicators such as the 7-day Relative Strength Index (RSI) and the 14-day Money Flow Index (MFI) revealed sustained buying pressure. Notably, yesterday both RSI and MFI approached the overbought threshold—71.96 and 71.91 respectively—indicating a strong short-term buying trend, while simultaneously suggesting the possibility of a price correction in the near term.
Examining the Bollinger Bands, Bitcoin’s price has neared the upper band, signaling an expansion phase supported by increasing trading volume. Trading volume notably rose in recent days, peaking around 20,959 trades on July 22, 2025. This surge highlights growing market interest and hints at heightened institutional participation. Conversely, a decline in volume and trade count on July 19 pointed to a brief slowdown in market activity.
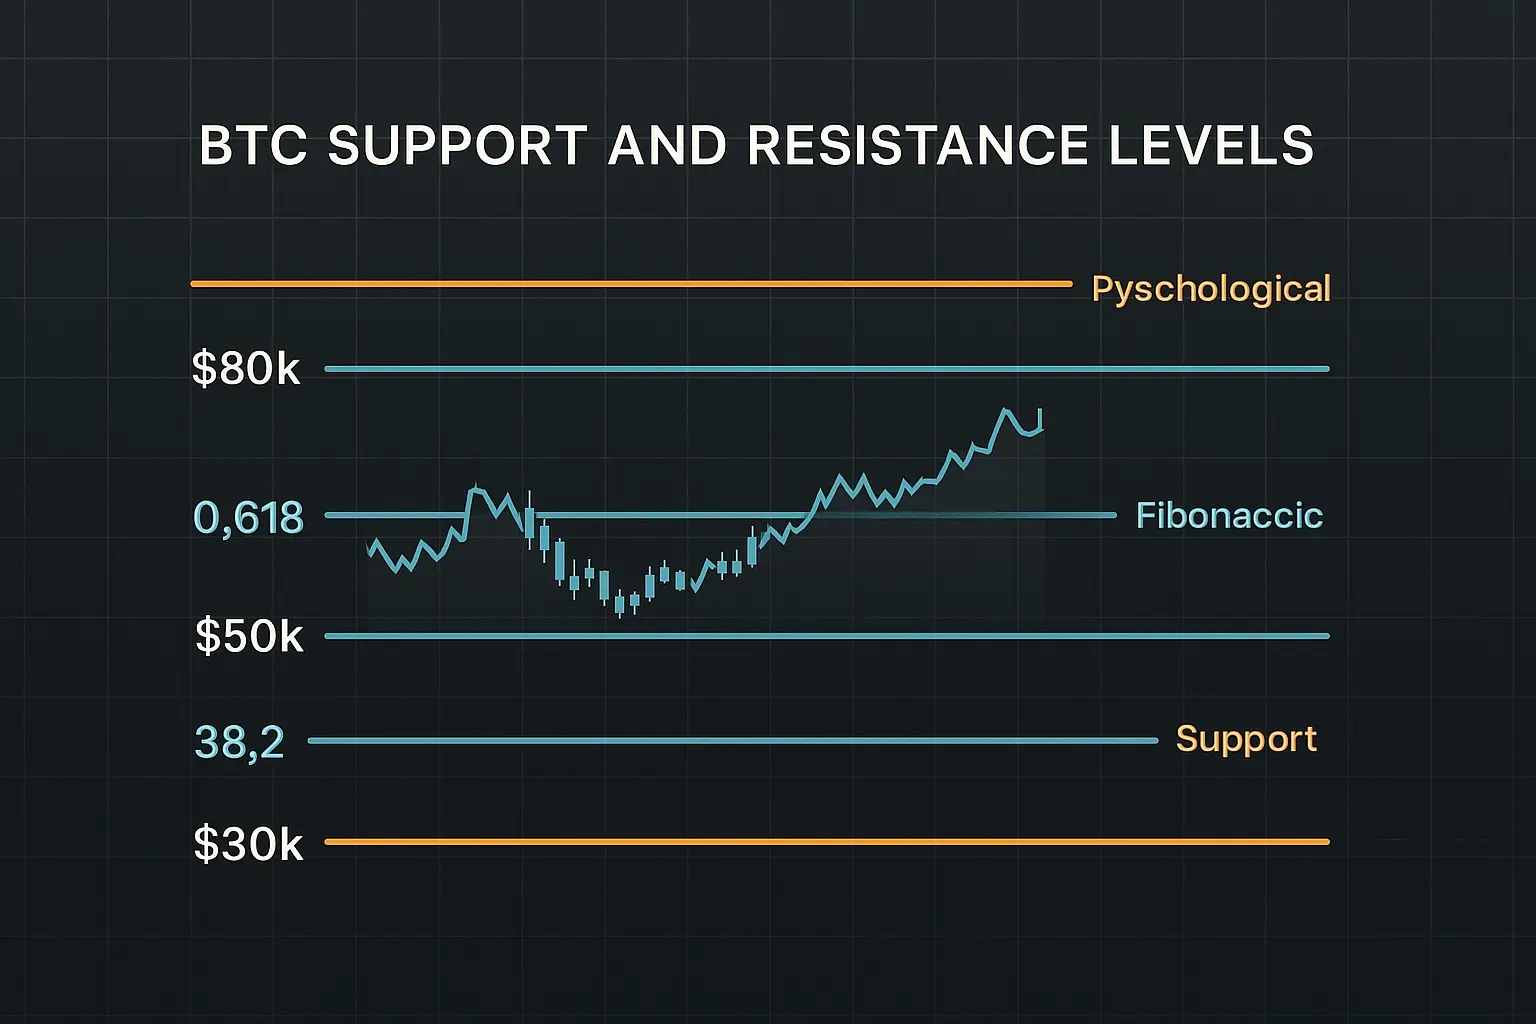
From a support and resistance standpoint, the zone between 117,758 and 115,222 appears to be a strong support level. Should this range be breached, the next support lies between 105,681 and 104,872. On the upside, the psychological resistance at 120,000 remains a critical hurdle; surpassing this level could trigger further price gains. Meanwhile, the Fear and Greed Index hovers near 72, reflecting slightly elevated greed in the market. This suggests some investors, particularly those holding substantial Bitcoin positions, may begin to take profits.
In terms of recent developments, regulatory encouragement from the U.S. Treasury and President Trump’s signing of the GENIUS Act have bolstered investor confidence, enhancing prospects for institutional investment. However, data from Glassnode indicates an uptick in Bitcoin transfers from whales to exchanges, possibly signaling profit-taking or increased market liquidity. Additionally, easing inflation rates and rising consumer confidence in the U.S. are positive factors underpinning market sentiment.
Overall, Bitcoin’s current price movement, increased volume, and favorable news flow portray a strong yet cautious market trend. While a short-term price rally remains plausible, overbought signals and whale activity suggest a correction could be imminent. Investors are advised to approach the market with balanced strategies, carefully weighing risks and opportunities in the current environment.
Data Summary
- 1. Time:
2025-07-23 – 00:00 UTC - 2. Prices:
Open: 117380.36000000High: 120247.80000000Low: 116128.00000000Close: 119954.42000000
- 3. Last 5 days’ closing prices:
2025-07-18: 117924.840000002025-07-19: 117840.000000002025-07-20: 117265.120000002025-07-21: 117380.360000002025-07-22: 119954.42000000
- 4. Volume:
BTC: 20959.1297USD: $2481252763.6519
- 5. Number of trades:
2778733
- 6. Indicators:
RSI: 71.9600MFI: 71.9100BB Upper: 123761.96000000BB Lower: 105576.78000000MACD: 2958.64000000Signal: 2947.44000000Histogram: 11.19000000
- 7. Moving Averages:
SMA:7=118310.3900000014=117646.4500000021=114669.3700000030=112309.6800000050=109513.00000000100=104268.34000000200=98055.70000000EMA:
7=118162.6600000014=116716.9500000021=115176.8800000030=113524.8300000050=110651.32000000100=105473.28000000200=98362.13000000HMA:
7=118339.4500000014=118196.4700000021=120086.0700000030=120867.5800000050=118739.22000000100=114200.80000000200=114143.28000000 - 8. Supports:
S1: 117758.09000000 – 115222.22000000S2: 105681.14000000 – 104872.50000000S3: 101509 – 99950.8
- 9. Resistances:
Only Psychological Resistance
- 10. Psychological Support:
110000.00000000
- 11. Psychological Resistance:
120000.00000000
- 12. Funding Rate:
0.01%
- 13. Open Interest:
90303.9410
- 14. Fear & Greed Index:
72 (Greed)
Disclaimer: This market analysis is generated by AI based on historical BTC data and sentiment indicators. Use it as a reference, not financial advice.
