
Market Analysis
**Introduction**
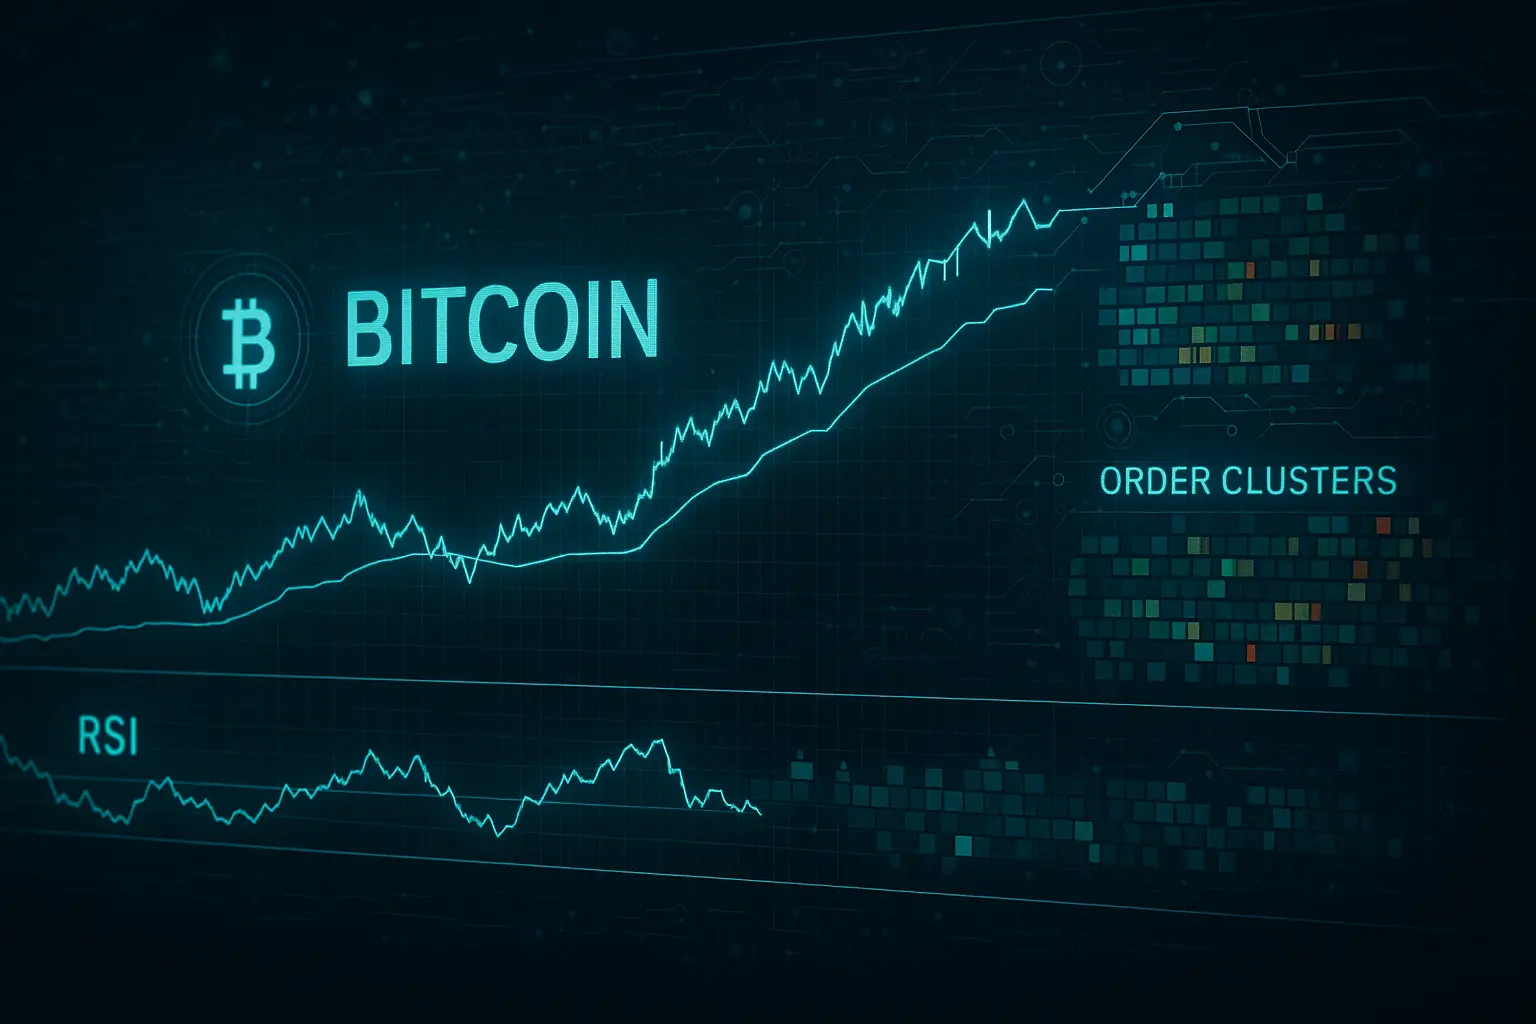
Bitcoin has reached a new all-time high today, signaling not only growing confidence within the market but also offering a positive outlook for the future of cryptocurrencies on a global scale. This achievement reflects the significant impact of various economic and political factors, as well as investor sentiment, all of which will be explored in detail in today’s analysis.
**Analysis**
Over the past five days, Bitcoin has experienced a notable price rally accompanied by significant changes in trading volume, paving the way for its record-breaking high. On July 9th, the price opened at 108,922 and closed at 111,233, followed by a sharp increase on July 10th and 11th, reaching levels between 116,010 and 117,527. Key technical indicators such as the 7-period RSI and 14-period MFI reinforce the strength behind this uptrend. The RSI surged to 85.59, entering the overbought territory, which typically signals a temporary excess in buying pressure. However, the decline in both volume and the number of trades suggests that caution may be warranted despite the strong momentum.
Bollinger Bands analysis reveals that Bitcoin’s price recently touched the upper band, indicating heightened market volatility and bullish momentum. At the same time, the narrowing of the bands suggests that a price correction or consolidation could be forthcoming. On the support front, a solid range lies between 117,420 and 108,262, while a break below this zone would likely see support near 105,681 to 104,872. Psychologically, the 110,000 level remains a crucial support, whereas resistance sits near 120,000, marking a significant hurdle for further upward movement.
From a macro perspective, recent U.S. political and economic developments have positively influenced Bitcoin’s price. Notably, former President Trump’s proposal to reduce interest rates and initiatives from the U.S. House of Representatives to position the country as a global crypto hub have bolstered investor confidence. Additionally, major corporations increasing their investments in Ethereum and other crypto assets have contributed to overall market stability, indirectly supporting Bitcoin’s gains. The current Fear & Greed Index stands at 74, pointing toward extreme greed, which suggests a possibility of profit-taking in the short term.
In summary, Bitcoin’s current trajectory reflects a robust uptrend; however, the overbought signals from RSI and MFI, coupled with declining volume, advise cautious optimism. Institutional investment is on the rise, while smaller holders continue to sell, creating a balanced dynamic for further price volatility. The 120,000 resistance level is pivotal—surpassing it could open the door to sustained long-term growth, whereas failure to do so may lead to near-term corrections. Investors are recommended to closely monitor market sentiment alongside global political and economic developments to make informed decisions.
Data Summary
- 1. Time:
2025-07-14 – 00:00 UTC - 2. Prices:
Open: 117420.00000000High: 119488.00000000Low: 117224.79000000Close: 119086.64000000
- 3. Last 5 days’ closing prices:
2025-07-09: 111233.990000002025-07-10: 116010.000000002025-07-11: 117527.660000002025-07-12: 117420.000000002025-07-13: 119086.64000000
- 4. Volume:
BTC: 9550.7929USD: $1132096857.0117
- 5. Number of trades:
1650283
- 6. Indicators:
RSI: 85.5900MFI: 75.4500BB Upper: 117769.25000000BB Lower: 101613.45000000MACD: 2912.90000000Signal: 1775.86000000Histogram: 1137.04000000
- 7. Moving Averages:
SMA:7=114066.3200000014=111079.4600000021=109691.3500000030=108060.0000000050=107414.09000000100=100931.99000000200=97003.08000000EMA:
7=115076.3400000014=112353.4800000021=110821.4800000030=109522.0100000050=107292.79000000100=102922.00000000200=96473.75000000HMA:
7=120320.5900000014=117656.5200000021=115632.8100000030=113709.7500000050=110807.50000000100=110044.59000000200=110294.89000000 - 8. Supports:
S1: 117420.00000000 – 108262.94000000S2: 105681.14000000 – 104872.50000000S3: 101509 – 99950.8
- 9. Resistances:
Only Psychological Resistance
- 10. Psychological Support:
110000.00000000
- 11. Psychological Resistance:
120000.00000000
- 12. Funding Rate:
0.01%
- 13. Open Interest:
88029.0210
- 14. Fear & Greed Index:
74 (Greed)
Disclaimer: This market analysis is generated by AI based on historical BTC data and sentiment indicators. Use it as a reference, not financial advice.
