
Market Analysis
**Introduction**
In recent days, Bitcoin has attempted to break through the significant 110,000 level but was unable to surpass the key liquidity cluster around 113,000. The market currently exhibits signs of caution and some selling pressure, resulting in a slight retracement near the 103,000 mark. Today, we will analyze Bitcoin’s current status in light of these developments and the latest market news.
**Analysis**
Despite some price fluctuations over the past five days, Bitcoin’s market has shown a degree of stability. On July 4th, Bitcoin opened at 109,584 and closed slightly lower at 107,984, indicating a relatively balanced interplay between buyers and sellers. Both the RSI (Relative Strength Index) and MFI (Money Flow Index) remain above 50, suggesting a generally healthy market tone, though their oscillations reflect underlying price uncertainty.
On July 5th and 6th, Bitcoin saw modest gains, with July 6th’s peak at 109,203 signaling a brief positive momentum. However, prices retreated again on July 7th and 8th, closing near 108,000. Trading volumes fluctuated throughout this period, underscoring investor caution as the market attempted to sustain price levels without large-scale buying or selling.
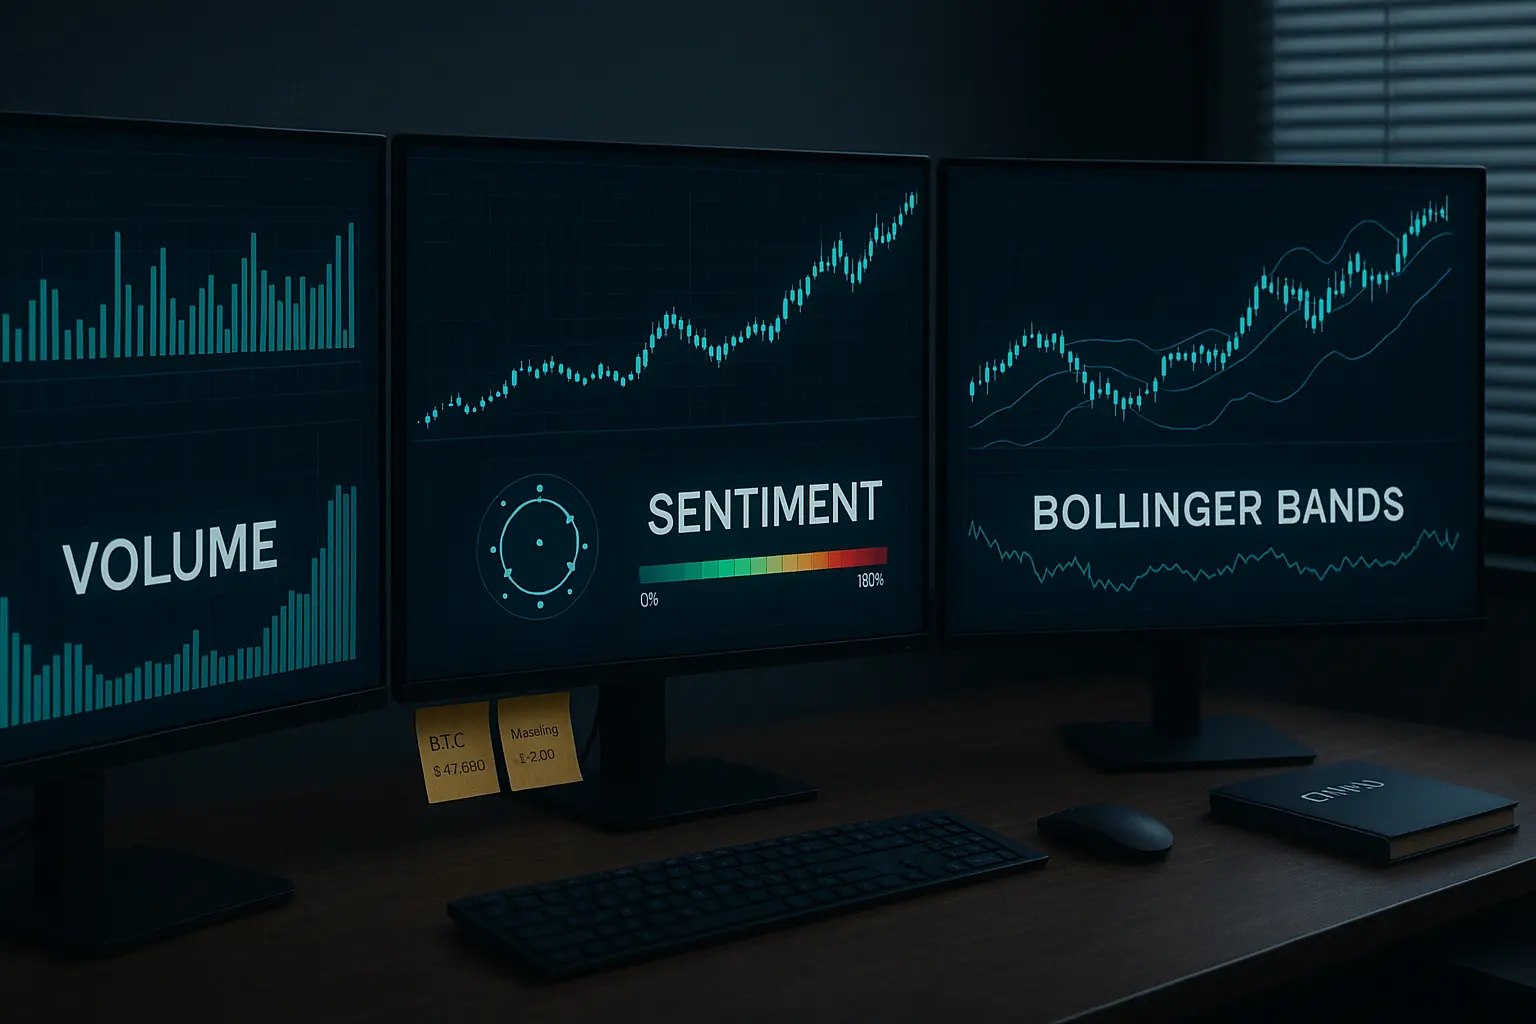
Examining the Bollinger Bands, Bitcoin’s price has mostly hovered near the midline, around 106,579, while failing to test the upper band near 111,162. This behavior points to market pressure and indecision. Moreover, despite some minor price swings, the band width has remained relatively narrow, indicating low volatility.
Looking at moving averages, particularly the 7-day Hull Moving Average (HMA) at approximately 108,760, the price remains close and slightly above recent levels, reflecting mild bullishness. However, no clear bullish or bearish trend has yet been established.
From a broader perspective, increased interest from large investors—or whales—is notable, especially those bringing older, “gold-like” Bitcoin holdings back into the market. Additionally, investments in Bitcoin and Ethereum ETFs have risen in both the US and European markets, offering a positive signal. However, regulatory complexities around digital currencies in Europe and shifting US government policies have introduced some uncertainty.
The Fear & Greed Index has fluctuated between 65 and 73 recently, reflecting a mix of moderate greed and fear among market participants. In this environment, investors should exercise caution, as sudden market shifts remain possible, particularly given resistance near the 110,000 level.
**Summary**
Overall, Bitcoin’s price has remained confined to a narrow range in recent days, with a decisive breakout above 110,000 yet to materialize. The mid-level RSI and MFI readings, limited Bollinger Band expansion, and slightly bullish moving averages suggest a balance between upward and downward forces. While whale activity and growing ETF investments provide positive momentum, regulatory concerns in Europe and policy uncertainties in the US could impede further gains. Should Bitcoin manage to close above the 113,000 liquidity cluster, further short-term upside is likely. Otherwise, the price may drift back toward support around 103,000. Given the current volatility and mixed signals, a cautious approach is advisable for investors navigating this uncertain market.
Data Summary
- 1. Time:
2025-07-09 – 00:00 UTC - 2. Prices:
Open: 108262.94000000High: 109216.56000000Low: 107429.57000000Close: 108922.98000000
- 3. Last 5 days’ closing prices:
2025-07-04: 107984.240000002025-07-05: 108198.120000002025-07-06: 109203.840000002025-07-07: 108262.940000002025-07-08: 108922.98000000
- 4. Volume:
BTC: 9216.0208USD: $1000112813.4399
- 5. Number of trades:
1723244
- 6. Indicators:
RSI: 58.3300MFI: 59.4500BB Upper: 111162.40000000BB Lower: 101996.38000000MACD: 935.82000000Signal: 770.61000000Histogram: 165.20000000
- 7. Moving Averages:
SMA:7=108715.2100000014=107915.9400000021=106579.3900000030=106714.7500000050=106653.94000000100=99292.48000000200=96523.95000000EMA:
7=108412.9100000014=107783.3200000021=107309.6800000030=106768.1000000050=105278.07000000100=101512.47000000200=95457.74000000HMA:
7=108760.5700000014=109013.7200000021=109278.6200000030=109019.0600000050=107303.38000000100=109273.68000000200=108615.88000000 - 8. Supports:
S1: 105681.14000000 – 104872.50000000S2: 103985.48000000 – 103105.09000000S3: 96945.63000000 – 90056.17000000S4: 89856 – 87325.6
- 9. Resistances:
R1: 109203.84000000 – 109767.59000000
- 10. Psychological Support:
100000.00000000
- 11. Psychological Resistance:
110000.00000000
- 12. Funding Rate:
0.0036% (Technically Positive)
- 13. Open Interest:
78235.7380
- 14. Fear & Greed Index:
65 (Greed)
Disclaimer: This market analysis is generated by AI based on historical BTC data and sentiment indicators. Use it as a reference, not financial advice.
