
Market Analysis
**Introduction**
Bitcoin has recently struggled to surpass the critical threshold of 110,000, and its failure to break through the liquidity cluster around 113,000 has injected a degree of uncertainty into the market. Currently, the price appears to be under moderate pressure near the 103,000 level. Today, we will provide a detailed examination of this situation.
**Analysis**
Over the past five days, Bitcoin’s price has experienced notable volatility. Starting at 108,356 and closing near 107,984, the price was unable to breach the key resistance level of 109,000. Despite fluctuations in the 7-period RSI, which mostly stayed above 50—indicating some underlying strength—the RSI oscillated between 55 and 66, reflecting prevailing market indecision. Similarly, the 14-period Money Flow Index ranged between 40 and 57, signaling moderate selling pressure in relation to liquidity.
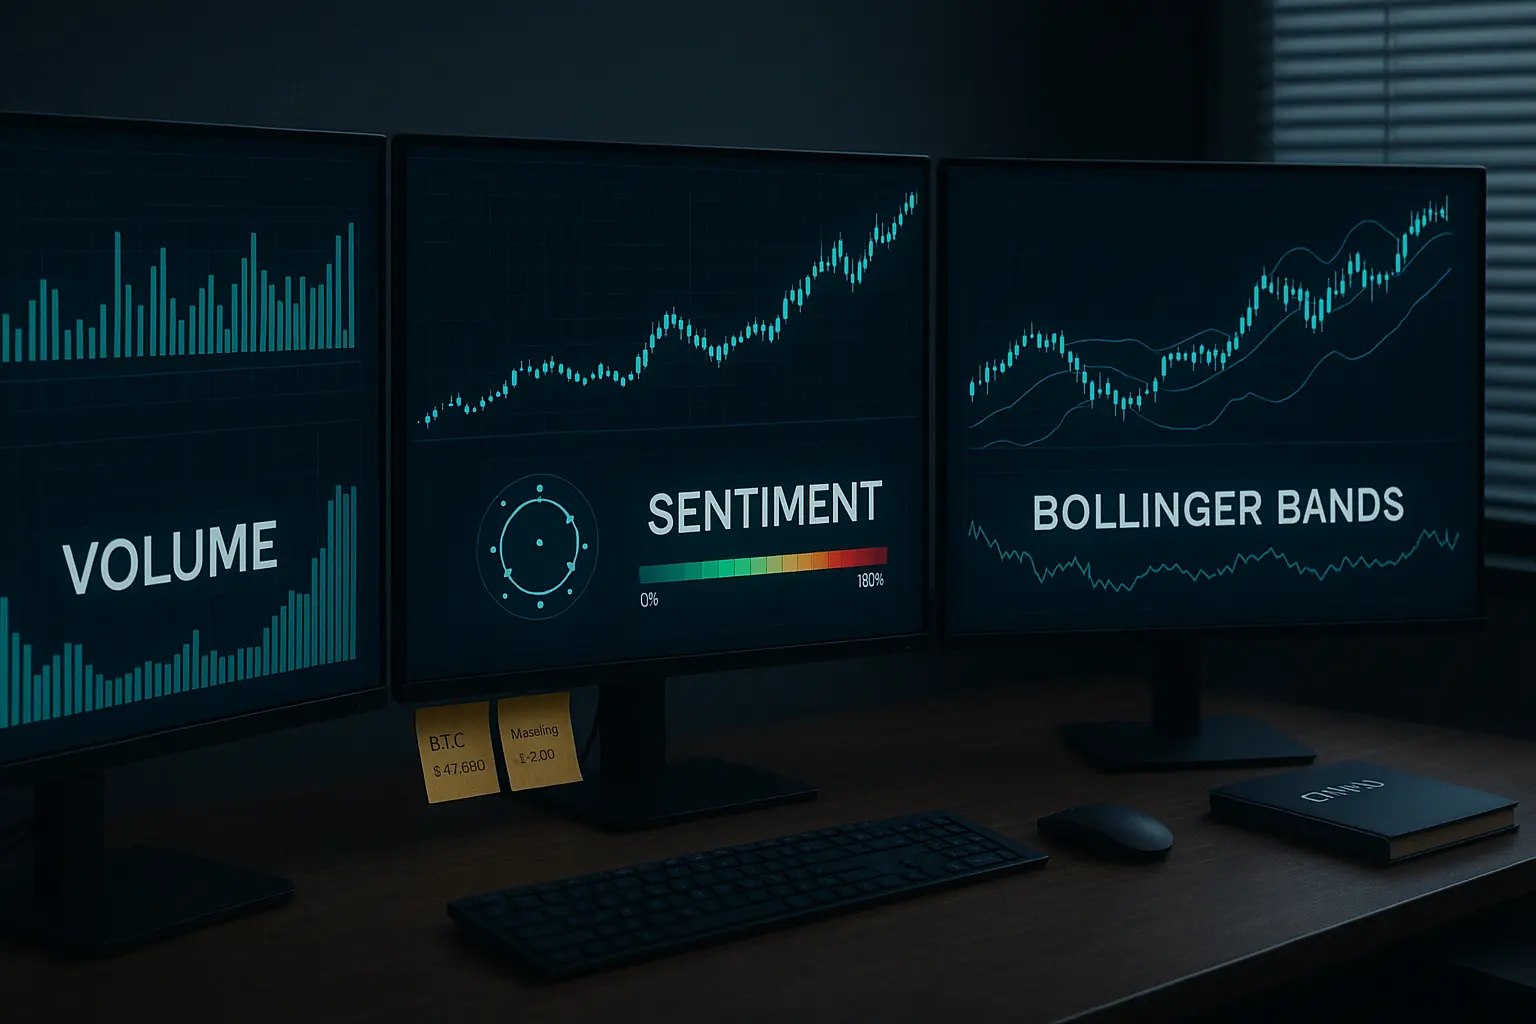
Trading volumes also showed variability. On July 2, 2025, volumes peaked at approximately 17,691, suggesting a temporary buying surge; however, volume decline thereafter pointed to weakening market momentum. Examining the Bollinger Bands, prices largely hovered near the middle band, indicating an absence of a clear trend and confinement within a tight trading range. The failure to reach the upper band and the retreat toward the midline corroborate the current bearish or neutral bias.
Support levels are positioned sequentially at S1 (105,681–104,872), S2 (101,508–99,950), and S3 (96,945–90,056). A breach of the first support could place additional pressure on the price, with the subsequent supports providing stronger defense. On the resistance side, R1 (109,434–110,797) and the psychological barrier at 110,000 remain significant hurdles preventing upward momentum.
The funding rate and open interest have seen slight upticks, indicating modest market engagement, though not enough to trigger a substantial price rally. The Fear & Greed Index remains steady at 66, reflecting moderate greed, which suggests some investors may look to take profits in the short term. News flow aligns with the neutral outlook, as no decisive bullish or bearish catalysts have emerged. Notably, a large Bitcoin purchase by Japanese company Meta Plant has caused some concern, while uncertainties surrounding U.S. economic policies and tax reforms continue to keep investors cautious.
In summary, Bitcoin is navigating a complex phase. Its inability to surpass the 110,000 mark has pushed the market into a neutral to bearish stance. Although the psychological support at 100,000 remains intact, the unbroken 113,000 liquidity cluster and subdued funding rates point to a lack of strong upward momentum currently. Investors are advised to closely monitor support and resistance levels and to stay attuned to news developments and market sentiment before anticipating any major moves. Short-term corrections are likely, while the mid-term price trajectory will largely depend on how the market responds in the coming days.
Data Summary
- 1. Time:
2025-07-05 – 00:00 UTC - 2. Prices:
Open: 109584.77000000High: 109767.59000000Low: 107245.00000000Close: 107984.24000000
- 3. Last 5 days’ closing prices:
2025-06-30: 107146.500000002025-07-01: 105681.140000002025-07-02: 108849.600000002025-07-03: 109584.780000002025-07-04: 107984.24000000
- 4. Volume:
BTC: 11793.8662USD: $1276215111.6684
- 5. Number of trades:
1975212
- 6. Indicators:
RSI: 55.0100MFI: 57.2400BB Upper: 110178.37000000BB Lower: 101815.32000000MACD: 842.26000000Signal: 562.70000000Histogram: 279.55000000
- 7. Moving Averages:
SMA:7=107842.8500000014=106481.1400000021=105996.8400000030=106131.2600000050=106334.55000000100=98313.55000000200=96359.04000000EMA:
7=107818.8400000014=107099.7600000021=106682.4000000030=106190.5800000050=104692.39000000100=100917.98000000200=94919.42000000HMA:
7=109299.9400000014=108630.5900000021=108790.7800000030=107481.2800000050=106260.74000000100=109444.38000000200=107450.61000000 - 8. Supports:
S1: 105681.14000000 – 104872.50000000S2: 101508.68000000 – 99950.77000000S3: 96945.63000000 – 90056.17000000S4: 87325.6 – 86310
- 9. Resistances:
R1: 109434.79000000 – 110797.38000000
- 10. Psychological Support:
100000.00000000
- 11. Psychological Resistance:
110000.00000000
- 12. Funding Rate:
0.0018% (Technically Positive)
- 13. Open Interest:
82935.4930
- 14. Fear & Greed Index:
73 (Greed)
Disclaimer: This market analysis is generated by AI based on historical BTC data and sentiment indicators. Use it as a reference, not financial advice.
