
Market Analysis
**Introduction**
Bitcoin’s price has recently remained confined within a narrow range between 85,000 and 110,000, reflecting ongoing uncertainty in the crypto market. Recent news developments coupled with technical indicators have had a significant impact on price dynamics, prompting investors to adopt a cautious stance. In this report, we will take a comprehensive look at these factors to better understand the current market environment.
**Analysis**
Over the past five days, Bitcoin’s price has experienced notable volatility influenced by recent news and market activity. On June 3rd, the price opened at 105,858 and closed slightly lower at 105,376, with the Relative Strength Index (RSI) at 44.87 and the Money Flow Index (MFI) at 51.27—both suggesting moderate momentum. However, on June 4th, the price edged down further, closing at 104,696, accompanied by a decline in RSI to 40.51 and MFI to 39.69, indicating a weakening trend.
The downward pressure intensified on June 5th, when the price dropped sharply to 101,508. At that point, RSI fell to 26.43 and MFI to 28.13, nearing oversold territory and signaling temporary bearish pressure. Yet, on June 6th and 7th, Bitcoin attempted a recovery, climbing back to 105,552. During this rebound, the RSI rose to 52.26 while the MFI remained subdued at 42.17, producing mixed signals about the market’s direction.
Technical indicators further highlight this cautious sentiment. The MACD (Moving Average Convergence Divergence) declined from 1592 on June 3rd to 763 on June 7th, reflecting weakening momentum. From a Bollinger Bands perspective, the price faced resistance near the upper band’s midline on June 7th, remaining well above the lower band—an indication of limited price fluctuation within the range.
Examining moving averages, the Hull Moving Average (HMA) stood at 103,868 on June 7th, with the price closing above it—a modestly positive sign. However, the 14- and 21-day Simple Moving Averages (SMA) and Exponential Moving Averages (EMA) remain above the price level, suggesting the absence of a fully established uptrend.
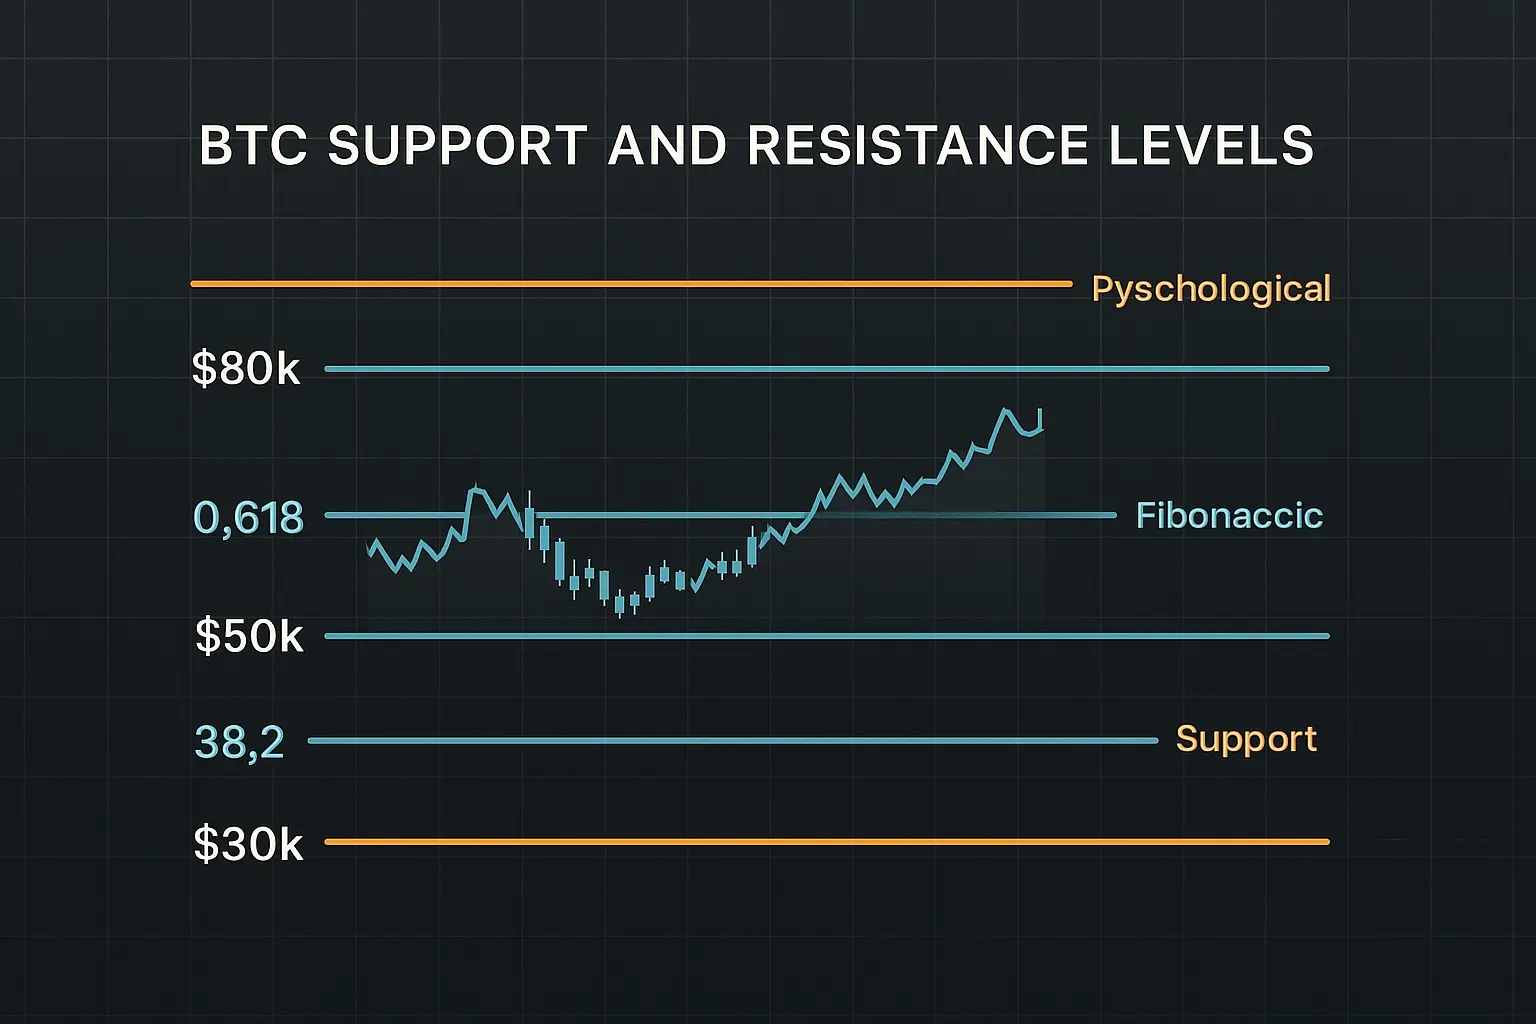
Regarding support and resistance levels, Bitcoin is currently finding support around the S1 zone between 103,985 and 103,105. A breakdown below this range would open the door to stronger support at the S2 level, spanning 101,508 to 99,950. Resistance lies within the R1 zone, between 105,857 and 106,457—close to recent highs—and a decisive breakout above this range would be required to signal further upward momentum. Psychological levels of 100,000 (support) and 110,000 (resistance) continue to play an important role in shaping market sentiment.
The Fear and Greed Index has fluctuated between 64 and 52 over the last five days, indicating a moderate level of greed tempered by cautiousness among investors. Minor upticks in funding rates and open interest suggest sustained market engagement but do not point to strong bullish or bearish trends. Market sentiment remains mixed: despite predictions of a potential interest rate cut by the Federal Reserve, inflation concerns and global economic uncertainties are keeping investors wary. Increased buying activity by large holders coupled with conflicting technical signals has resulted in a stable yet uncertain price range.
**Summary**
Overall, Bitcoin’s price has stabilized within a tight trading range, underscoring prevailing market uncertainty. Technical indicators and moving averages hint at a modestly positive bias, but a clear, sustained uptrend is lacking. Support and resistance levels are currently constraining price movements, while moderate greed coupled with cautious investor sentiment prevails. Given the mixed news environment and market conditions, no significant breakout or sharp decline appears imminent. Investors should remain vigilant, exercise caution, and await more definitive market signals before making decisive moves.
Data Summary
- 1. Time:
2025-06-08 – 00:00 UTC - 2. Prices:
Open: 104288.43000000High: 105900.00000000Low: 103871.09000000Close: 105552.15000000
- 3. Last 5 days’ closing prices:
2025-06-03: 105376.890000002025-06-04: 104696.860000002025-06-05: 101508.680000002025-06-06: 104288.440000002025-06-07: 105552.15000000
- 4. Volume:
BTC: 8344.9321USD: $877915380.9548
- 5. Number of trades:
1402494
- 6. Indicators:
RSI: 52.2600MFI: 42.1700BB Upper: 111121.13000000BB Lower: 101978.72000000MACD: 763.99000000Signal: 1544.53000000Histogram: -780.54000000
- 7. Moving Averages:
SMA:7=104703.4200000014=105875.0000000021=106549.9200000030=105673.5000000050=101018.38000000100=92620.78000000200=95250.47000000EMA:
7=104748.0200000014=105166.7400000021=104872.7900000030=103841.1300000050=101142.74000000100=96963.79000000200=91356.97000000HMA:
7=103868.0100000014=103587.1300000021=103340.3800000030=104945.2400000050=108504.31000000100=110500.26000000200=97951.26000000 - 8. Supports:
S1: 103985.48000000 – 103105.09000000S2: 101508.68000000 – 99950.77000000S3: 96945.63000000 – 90056.17000000S4: 87325.6 – 86310
- 9. Resistances:
R1: 105857.99000000 – 106457.44000000R2: 109434.79000000 – 110797.38000000
- 10. Psychological Support:
100000.00000000
- 11. Psychological Resistance:
110000.00000000
- 12. Funding Rate:
0.0003% (Technically Positive)
- 13. Open Interest:
84607.0430
- 14. Fear & Greed Index:
52 (Neutral)
Disclaimer: This market analysis is generated by AI based on historical BTC data and sentiment indicators. Use it as a reference, not financial advice.
