
Disclaimer: This market analysis is generated by AI based on historical BTC data and sentiment indicators. Use it as a reference, not financial advice.
Market Analysis
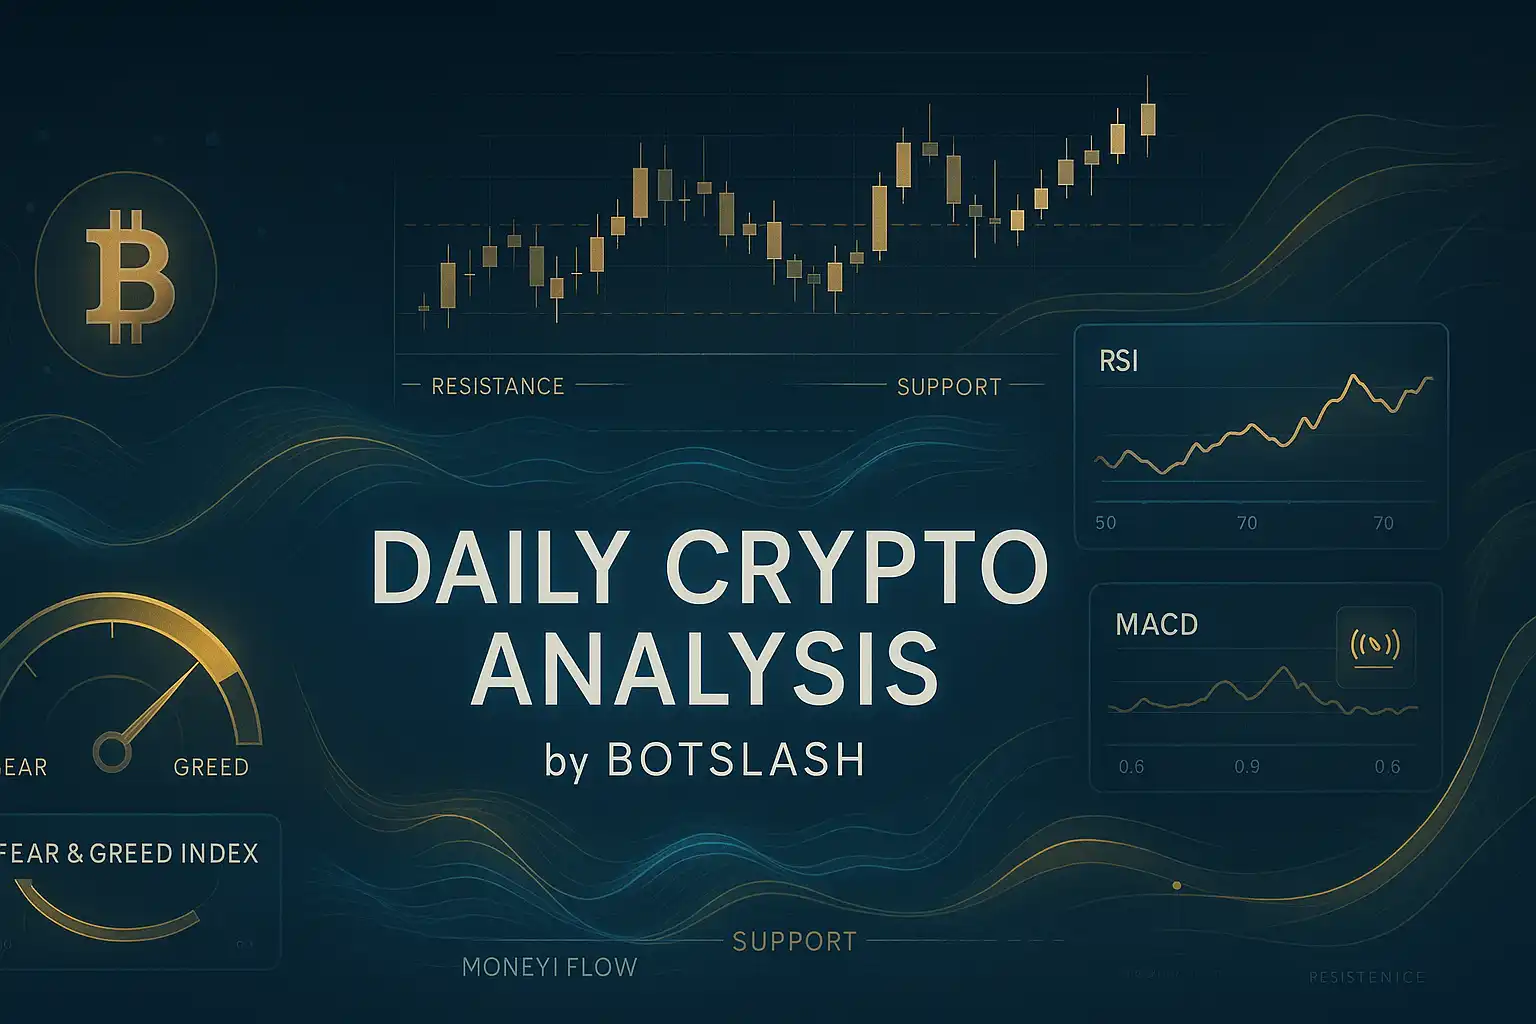
Over the past five days, Bitcoin’s price has experienced notable volatility, underscoring the importance of both technical indicators and market sentiment in understanding its trajectory. On May 26, Bitcoin opened at 109,004 and closed slightly higher at 109,434, with the Relative Strength Index (RSI) and Money Flow Index (MFI) standing at 64.79 and 61.04, respectively—levels suggestive of strong buying interest. However, in the following days, these momentum indicators weakened significantly. By May 29 and 30, the RSI declined from 42.02 to 35.45, signaling waning buying pressure and potential downside stress. The Moving Average Convergence Divergence (MACD) also trended downward, reflecting diminishing bullish momentum. Meanwhile, trading volumes and the number of trades increased, particularly on May 30, when volume reached 23,706 with over 4.3 million trades executed, indicating active participation from both buyers and sellers but also highlighting growing market tension. The Fear and Greed Index remained above 70 for most of this period, pointing to near-extreme greed in the market, though it moderated to around 60 on May 30, suggesting a slight easing of exuberance.
From a technical standpoint, Bitcoin continues to trade within a broad long-term range between 85,000 and 110,000. Recently, the price breached the 111,000 mark but retreated back into this established range. This behavior paints a predominantly neutral to cautiously bullish picture, as attempts to push higher encountered substantial resistance near the 113,000 liquidity cluster. This level represents a significant supply barrier that has historically been difficult to surpass. Should Bitcoin manage to break above this resistance convincingly, the next potential target lies near 120,000. On the downside, key support zones are identified around 103,507 to 102,277 (S1), 96,945 to 90,056 (S2), and 84,474 to 83,949 (S3), which could act as buffers against further declines. Bollinger Bands analysis reveals that on May 30, the price hovered near the lower band, implying short-term oversold conditions or weakening buying momentum. Additionally, an expansion in the band width reflects rising volatility within the market.
In terms of sentiment and external influences, recent global trade tensions, coupled with the delay in tariffs imposed by former U.S. President Trump on the European Union, have positively influenced Bitcoin’s price, temporarily boosting market confidence. Nevertheless, profit-taking by large investors has exerted downward pressure on prices. The divergence between MicroStrategy’s stock performance and Bitcoin itself prompted caution among some investors, while the growing popularity of meme coins such as PEPE and SHIB points to a diversification of market interest. Moreover, declining financing rates and open interest suggest an increasing number of short positions, which could weigh on prices in the near term. Given the Fear and Greed Index’s proximity to overbought territory, there is also the potential for short-term selling by whales, which may further depress prices.
Overall, Bitcoin’s current state reflects a complex equilibrium where technical signals and market sentiment offer mixed messages. The stabilization around 110,000 and resistance near 113,000 maintain a neutral to moderately bullish outlook. However, weakening short-term momentum indicators like RSI and MACD, combined with rising short interest, could introduce near-term downside risk. While the identified support levels provide some protection against sharp declines, breaking below these thresholds may open the door to more significant losses. Additionally, geopolitical and macroeconomic developments, alongside the strategies of major investors, will continue to play a crucial role in shaping price dynamics. Consequently, investors are advised to remain vigilant, integrating both technical analysis and broader market sentiment and news flow to make balanced, well-informed decisions.
Data Summary
- 2. Prices:
Open: 105589.75000000High: 106313.12000000Low: 103621.00000000Close: 103985.48000000
- 3. Last 5 days’ closing prices:
2025-05-26: 109434.790000002025-05-27: 108938.170000002025-05-28: 107781.780000002025-05-29: 105589.750000002025-05-30: 103985.48000000
- 4. Volume:
BTC: 23706.4980USD: $2493078549.5919
- 5. Number of trades:
4307572
- 6. Indicators:
RSI: 35.4500MFI: 47.9700BB Upper: 111203.19000000BB Lower: 101150.83000000MACD: 2531.93000000Signal: 3380.33000000Histogram: -848.40000000
- 7. Moving Averages:
SMA:7=107499.4400000014=107368.5200000021=106177.0100000030=103602.0000000050=97751.05000000100=91610.50000000200=94662.41000000EMA:
7=106704.4700000014=106415.9600000021=105168.5500000030=103281.4400000050=99817.58000000100=95626.20000000200=90247.25000000HMA:
7=104331.8700000014=107094.6600000021=108844.6300000030=109804.9500000050=110978.23000000100=107881.79000000200=94260.38000000 - 8. Supports:
S1: 103507.82000000 – 102277.55000000S2: 96945.63000000 – 90056.17000000S3: 84474.69000000 – 83949.52000000
- 9. Resistances:
R1: 104103.72000000 – 105500.00000000
- 10. Psychological Support:
100000.00000000
- 11. Psychological Resistance:
110000.00000000
- 12. Funding Rate:
0.0074%
- 13. Open Interest:
85633.7550
- 14. Fear & Greed Index:
60 (Greed)
