
Disclaimer: This market analysis is generated by AI based on historical BTC data and sentiment indicators. Use it as a reference, not financial advice.
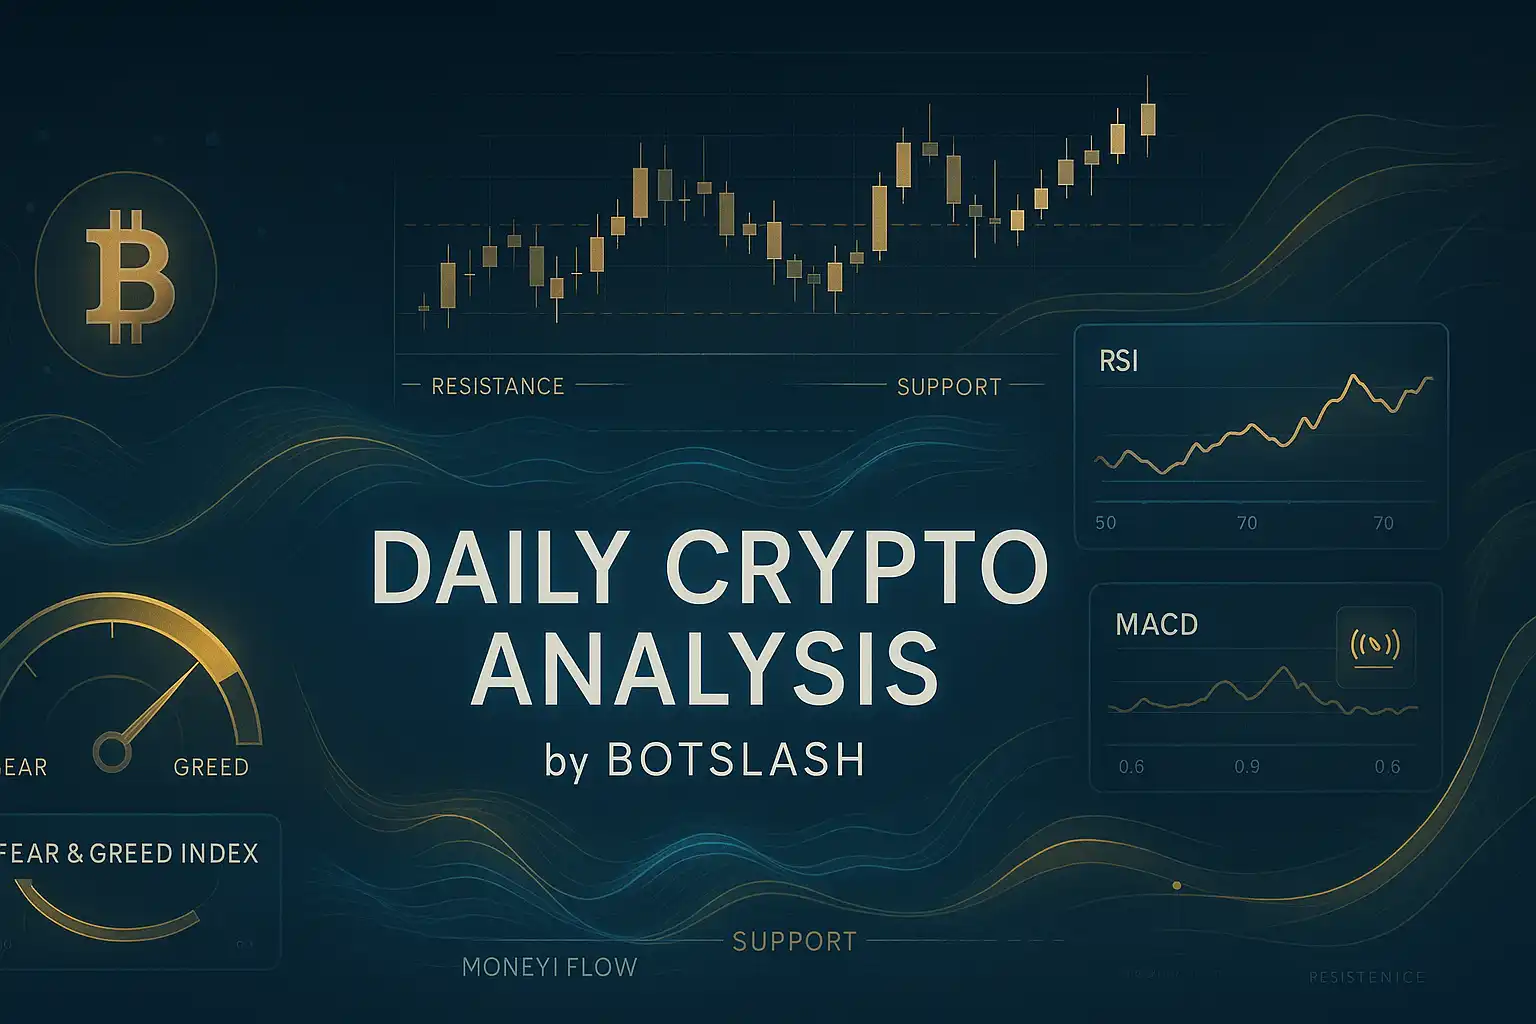
Market Analysis
Bitcoin has recently surpassed its previous all-time high, breaking through the significant psychological resistance level of $110,000 and marking an important milestone. On May 22, 2025, the cryptocurrency reached a peak of $111,980, signaling a robust bullish market. However, the following day saw a notable decline, with prices retreating to $107,318—reflecting typical profit-taking and selling pressure that often follow the breach of key resistance levels. The 7-day Relative Strength Index (RSI) dropped from an overbought 84.47 to a more moderate 57.31, indicating that the market has transitioned from an overheated state into a more stable and balanced zone. Similarly, the Money Flow Index (MFI) declined from 62.37 to 53.19, pointing to some degree of profit booking among investors. From a Bollinger Bands perspective, Bitcoin’s price touched the upper band before pulling back, suggesting a normal consolidation phase rather than excessive volatility, with prices currently contained within a defined range.
Trading volume and the number of transactions have diminished slightly over the past few days, particularly on May 24 and 25, where volumes hovered between 17,000 and 18,000—lower compared to previous trading sessions. This dip in activity may indicate a minor cooling in market participation; nonetheless, the Fear & Greed Index remains elevated between 70 and 74, suggesting a sentiment that is more optimistic than neutral. This dynamic implies that while some short-term traders are opting to lock in profits, long-term investors appear confident in Bitcoin’s future prospects. The MACD indicator also shows a slight decline but remains in positive territory, reinforcing the ongoing uptrend. Moving averages, especially the 7-day Hull Moving Average (HMA), stood near $108,070 on May 25, closely tracking the current price and signaling a stable upward momentum. Furthermore, the 14- and 21-day HMAs remain positioned above the price, reinforcing bullish sentiment.
On the fundamental front, confidence in the market has been bolstered by several key developments. Japan’s 30-year government bond yields have surged to historic levels; meanwhile, regulatory recognition and legal acceptance of Bitcoin in the United States, coupled with the establishment of a Bitcoin reserve in Texas, have enhanced institutional confidence. Notably, recent reassurances on tax reforms from the U.S. House of Representatives and increased institutional investments—including Strategy’s recent $765 million Bitcoin purchase—have contributed positively to market sentiment. However, rising global debt levels and financial challenges in Japan introduce some uncertainties, suggesting potential volatility in the short term. Additionally, with the Fear & Greed Index approaching 74, there is a likelihood of short-term profit-taking, especially as price nears critical resistance zones. Should Bitcoin manage to break through the range between $111,980 and $112,367, it could serve as a springboard for the next major rally. Conversely, failure to do so may result in a retreat toward key support levels between $106,600 and $107,318.
Overall, Bitcoin maintains a strong bullish posture, having cleared a significant technical hurdle. The slight pullback in price and reduction in volume suggest a healthy consolidation phase rather than a reversal. Current technical indicators and market sentiment point to sustained rally potential, provided that support levels hold firm and the resistance range is breached. Nonetheless, investors are advised to exercise caution in the near term, as global financial conditions and regulatory developments may influence price dynamics. A balanced approach that considers both technical and fundamental factors will be essential, along with preparedness for possible market fluctuations.
Data Summary
- 2. Prices:
Open: 107761.90000000High: 109299.99000000Low: 106600.64000000Close: 109004.19000000
- 3. Last 5 days’ closing prices:
2025-05-21: 109643.990000002025-05-22: 111696.210000002025-05-23: 107318.300000002025-05-24: 107761.910000002025-05-25: 109004.19000000
- 4. Volume:
BTC: 17710.0470USD: $1904366455.4259
- 5. Number of trades:
3151168
- 6. Indicators:
RSI: 63.2700MFI: 53.7100BB Upper: 112367.44000000BB Lower: 96091.51000000MACD: 3829.30000000Signal: 3893.47000000Histogram: -64.17000000
- 7. Moving Averages:
SMA:7=108264.0500000014=106075.6900000021=104229.4800000030=101471.5800000050=94959.21000000100=91071.04000000200=93974.07000000EMA:
7=107908.4300000014=106082.0800000021=104128.2100000030=101827.5400000050=98220.15000000100=94420.62000000200=89382.29000000HMA:
7=108070.3500000014=109900.1800000021=109682.1000000030=109533.7200000050=109419.41000000100=104209.35000000200=91595.96000000 - 8. Supports:
S1: 107318.30000000 – 106600.64000000S2: 103507.82000000 – 102277.55000000S3: 96945.63000000 – 90056.17000000
- 9. Resistances:
R1: 111696.21000000 – 111980.00000000
- 10. Psychological Support:
100000.00000000
- 11. Psychological Resistance:
110000.00000000
- 12. Funding Rate:
0.0037% (Technically Positive)
- 13. Open Interest:
86276.1070
- 14. Fear & Greed Index:
74 (Greed)
