
Will FIS (StaFi) live?
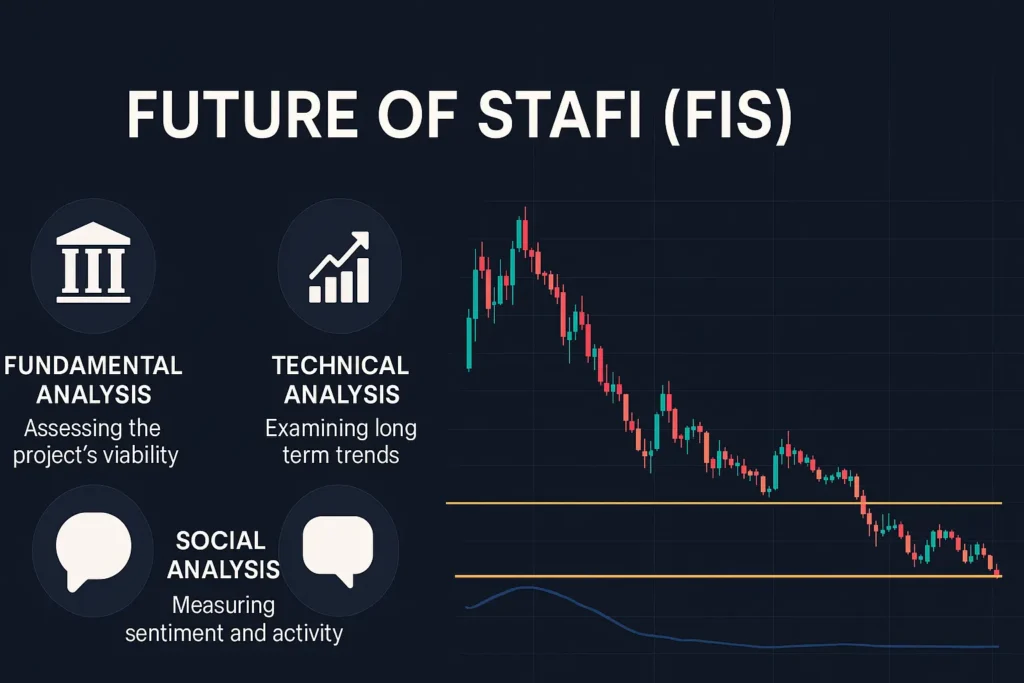
StaFi (FIS) – A Comprehensive Analysis: Opportunities, Challenges, and Current Status Introduction and Core Technology StaFi (short for Staking Finance), which possess token FIS, has positioned itself as a notable name in the decentralized finance (DeFi) ecosystem, aiming to solve a longstanding problem faced by PoS (Proof of Stake) investors—the illiquidity of staked assets. Typically, when users stake their PoS tokens, those assets become locked and inaccessible for trading or use in other DeFi protocols. StaFi tackles this issue through its rToken model: when users stake their tokens via the StaFi protocol, they receive an equal amount of rTokens in return. These rTokens represent both the underlying staked asset and the staking rewards, offering users continued liquidity without compromising their contribution to network security. Importantly, StaFi is not restricted to a single blockchain. Instead, it operates on a multi-chain architecture, enabling support for assets across leading networks such as Ethereum, Polkadot, and Cosmos. This flexibility allows users to stake across different chains while maintaining liquidity via rTokens. StaFi’s infrastructure combines staking pools and its rToken issuance system to deliver a comprehensive liquid staking solution for modern crypto investors. Founding Team, Vision, and Leadership Founded in 2019 by Liam Young and Tore Zhang, StaFi benefits from the leadership of individuals with deep blockchain experience. According to a Medium article, Liam Young is the author of Mastering Proof of Stake and previously founded Wetez, a staking mining pool. The team comprises experts familiar with major networks such as Polkadot, Ethereum, and Cosmos. While the technical core is solid, the project’s advisory board features few prominent public figures. StaFi was backed early on by strategic investors including Woodstock (India) and TGR Capital (Netherlands), lending credibility and institutional support to its foundational stage. FIS Tokenomics and Financial Structure StaFi’s native token, FIS, is built on the Substrate parachain framework within the Polkadot ecosystem. Initially capped at 100 million tokens, the total supply was transparently allocated among the community, team, advisors, private sale contributors, and ecosystem development initiatives. FIS serves three key purposes: paying network transaction fees, rewarding validators, and enabling governance participation. StaFi employs Polkadot’s Nominated Proof of Stake (NPoS) consensus, which issues new tokens annually through inflation to incentivize network participants. Initially, the inflation rate stood at 10% per year. As of June 2025, the total supply has exceeded 113 million FIS. To counter ongoing inflation and shift toward a deflationary model, StaFi proposed a major policy in August 2024 to burn the share of FIS tokens allocated to the treasury from each block—effectively reducing net inflation to around 6%. Alongside this, the team introduced FIS Tokenomics V2, aiming to decrease dependency on rTokens, enhance protocol security, and introduce new use cases for FIS, including fee mechanisms under Liquid Staking as a Service (LSaaS). Recent Developments, Features, and Partnerships StaFi has achieved several notable milestones since launch. These include successful integrations with Polkadot and Cosmos, the rollout of rTokens across Ethereum and other EVM-compatible chains, the introduction of the StaFi 2.0 vision, and the launch of its LSaaS platform. More recently, the project has embraced the AI finance narrative, unveiling tools such as the Staking Code Agent and Assistant Agent. These leverage language models to automate staking operations and enhance accessibility for both developers and end-users. On the partnership front, StaFi has collaborated with prominent blockchain infrastructure players including Chainlink (for CCIP), Everstake/Everclear (for cross-chain operations), zkMe (for zero-knowledge proofs), and Vouch (for Ethereum LSD staking). To date, over a dozen rTokens have been released, including rETH, rBNB, rMATIC, and rATOM. In 2024, StaFi expanded to The Open Network (TON) and Sei Network, highlighting its intention to scale across emerging ecosystems. Market Performance and Price History FIS debuted in 2020 via a public offering on the AscendEX launchpad, with an initial sale price of approximately $1.00. It was quickly listed on major exchanges such as Binance, Coinbase, and Huobi. The 2021 bull market propelled FIS to an all-time high of $4.31. However, the token experienced a steady decline during the ensuing bear market and dropped below $1 in 2022. Throughout 2023 and 2024, FIS traded between $0.10 and $0.50. As of June 2025, the token is priced around $0.13, with a market capitalization ranging from $15 million to $20 million. Daily trading volume has largely dwindled to a few million dollars. This declining activity indicates reduced investor confidence and poses challenges for maintaining listings on top-tier exchanges. While trading volumes occasionally spike during news cycles, FIS generally suffers from low liquidity and muted market interest. Technical Analysis and Trading Patterns From a technical standpoint, FIS has been in a prolonged downtrend since its 2021 peak. The price has consistently formed lower highs and lower lows, losing more than 97% of its value. Key support is established around the $0.10–$0.12 range, while short-term resistance is observed near $0.18–$0.20. RSI remains in the oversold zone, and MACD has remained in negative territory, highlighting persistent bearish momentum. The 200-day moving average lies well above the current price, further indicating structural weakness. Volume trends reinforce this bearish narrative. Average daily volume dropped from ~$13.9M in 2021 to ~$4.7M in 2023. While some short-lived spikes have occurred in recent months, the overall pattern reflects a shrinking market presence and increased risk of slippage for larger trades. Community Sentiment and Social Outlook StaFi maintains a moderately active community presence across Twitter, Telegram, and Discord. The team frequently posts updates, holds community calls, and conducts AMA sessions. However, engagement on platforms like Reddit remains low. Overall, the sentiment is currently between bearish and neutral. Long-term holders are discouraged by FIS’s sharp decline, although some remain hopeful due to ongoing developments in staking and AI. The assignment of a “Monitoring Tag” by Binance in mid-2025 further dampened market sentiment. Although not an immediate delisting, the tag signals increased scrutiny and raised fears among investors, which has directly impacted price volatility and liquidity. Analyst and Influencer Perspectives FIS has fallen off the radar for most prominent analysts and influencers. Major crypto
4 Clear Signs Altcoin Season is Coming Soon and How to Benefit

Altcoin season is a very common and hyped term in crypto market. But What is it and when it comes? One needs to learn many things to understand this. Picture yourself in a bustling amusement park. Bitcoin is the biggest and most popular ride, attracting long lines and the most attention. However, the park is filled with many other exciting attractions, each offering unique experiences. Sometimes, these other rides become the main attractions, drawing crowds and stealing the spotlight from Bitcoin. This shift in focus is analogous to “Altcoin Season” or “Alt Season” in the cryptocurrency world, where alternative cryptocurrencies (altcoins) surge in popularity and performance. Understanding Altcoins Altcoins, short for “alternative coins,” are any cryptocurrencies other than Bitcoin. They are designed to address perceived limitations of Bitcoin or to offer different functionalities. Altcoins include a variety of coins such as Ethereum (known for its smart contracts), Litecoin (which offers faster transaction times), and Ripple (which focuses on global payment solutions). History of Altcoins The first altcoin, Namecoin, was created in April 2011. It aimed to decentralize domain registration, thereby making the internet more resistant to censorship. Soon after, many more altcoins emerged, each introducing unique features and improvements over Bitcoin. For example: Litecoin (2011): Created by Charlie Lee, Litecoin was designed to offer faster transaction times and a different hashing algorithm. Ripple (2012): Focused on enabling real-time, cross-border payments. Ethereum (2015): Introduced the concept of smart contracts, allowing for programmable transactions on the blockchain. The creation of these and other altcoins sparked innovation and competition in the cryptocurrency space. Each altcoin aimed to improve upon Bitcoin’s model or to serve niche purposes, such as privacy (Monero, Zcash) or governance (Dash). Why Do Altcoins Matter? Altcoins play a crucial role in the evolution of the cryptocurrency ecosystem. They drive innovation by experimenting with new features and use cases that Bitcoin does not offer. For example: Smart Contracts: Ethereum’s introduction of smart contracts allows for decentralized applications (dApps) and complex financial transactions without intermediaries. Privacy: Monero and Zcash focus on providing enhanced privacy features, making transactions untraceable. Scalability and Speed: Altcoins like Litecoin and Bitcoin Cash aim to offer faster transaction times and lower fees compared to Bitcoin. Why Does Altcoin Season Occur? 1. Bitcoin Price Movements Altcoin seasons often follow significant price increases in Bitcoin. When Bitcoin’s price stabilizes after a surge, investors seek new opportunities in altcoins, hoping for similar high returns. 2. New Projects and Innovations Innovative new projects can spark altcoin seasons. For example, when a new altcoin promises to solve a specific problem or offers a unique feature, it can attract significant investment. 3. Market Sentiment and Hype Media coverage, endorsements from influential figures, and social media buzz can generate hype around specific altcoins, leading to rapid price increases and investment inflows. 4. Technological Advancements Advancements in blockchain technology can drive interest in altcoins. Improvements in scalability, security, or the introduction of new features make certain altcoins more attractive investments. A Look Back at Previous Altcoin Seasons 2017-2018 Altcoin Season: This period saw a dramatic drop in Bitcoin dominance, from 86.3% to 38.69%. Bitcoin’s price fell from over $20,000 to under $6,000, while altcoins surged. The Initial Coin Offering (ICO) market boomed, with projects like EOS raising over $4 billion and Tezos $232 million, marking a significant rise in altcoin values. 2020-2021 Altcoin Season: Amid the COVID-19 pandemic, investors turned to altcoins, including meme coins like Dogecoin and Shiba Inu, which saw unprecedented growth. NFTs also boosted the market, causing Bitcoin dominance to drop from 70% to 38%, with altcoin market value doubling from 30% to 62%. Indicators of Altcoin Season 1. Decrease in Bitcoin Dominance A key indicator of altcoin season is a noticeable decrease in Bitcoin’s market dominance. Bitcoin’s market dominance refers to the proportion of the total cryptocurrency market capitalization that is attributed to Bitcoin. When Bitcoin’s dominance decreases, it means that a smaller percentage of the market’s wealth is held in Bitcoin, even if the total market capitalization remains constant. This shift indicates that a larger share of the total cryptocurrency market capitalization is moving into altcoins, which are cryptocurrencies other than Bitcoin. Essentially, during altcoin season, investors are diversifying their investments away from Bitcoin and into a variety of alternative cryptocurrencies, leading to their increased market share. You can check Bitcoin Dominance here, but note that dominance decreases after shifting of market share so it is a lagging indicator. 2. Performance of Top Altcoins During altcoin season, many of the top 50 altcoins by market capitalization tend to outperform Bitcoin. This trend indicates a shift in investor focus and interest from Bitcoin to these alternative cryptocurrencies. Investors seek potentially higher returns and diversify their portfolios by investing in these altcoins, which results in their relative market performance surpassing that of Bitcoin. 3. Increased Trading Volume in Altcoins Higher trading volumes of altcoins on cryptocurrency exchanges suggest growing interest and investment in these alternative cryptocurrencies. Increased trading activity indicates that more investors are buying and selling altcoins, reflecting heightened market enthusiasm and confidence in their potential for returns. This trend can be a strong indicator of a broader shift towards altcoin investment. 4. Custom indicators Some people provide custom indicators which show that the season is Bitcoin or Altcoin. You can check one here. Again note that this indicator will indicate after altcoin season happening, so it is also a lagging indicator. How to Navigate Altcoin Season 1. Research and Due Diligence Thoroughly research any altcoin before investing. Understand the project’s team, technology, use case, and community support to avoid scams and poorly designed projects. You can learn what to research here. 2. Diversification Diversify your investments across multiple altcoins to manage risk. By spreading your investments among various altcoins, you can reduce the impact of poor performance from any single cryptocurrency. A balanced portfolio can provide stability against market volatility, as gains in some altcoins can offset losses in others, leading to a more resilient investment strategy. 3. Setting Realistic
What is IDO, ICO, and IEO: The Evolution of Cryptocurrency Fundraising

This article will cover everything about what is IDO, ICO, and IEO. Imagine you’re at a bustling marketplace. Vendors are shouting, trying to get your attention, each with a unique product to sell. Now, instead of fruits, clothes, or electronics, these vendors are offering new digital currencies or tokens. This marketplace represents the world of cryptocurrency, and the vendors’ methods of selling their tokens are akin to ICOs, IDOs, and IEOs. Let’s delve into what these terms mean, their origins, differences, history, and impact, and take a look at some notable examples from the past. The Origins: ICO, IDO, and IEO Initial Coin Offering (ICO): Think of an ICO as a digital fundraiser. Companies create a new cryptocurrency or token and sell it to investors to raise money for their projects. This method became popular in 2017 and allowed startups to bypass traditional fundraising methods like banks or venture capital. Initial DEX Offering (IDO): An IDO is similar to an ICO but takes place on a decentralized exchange (DEX). This means the token sale is automated through smart contracts, offering more transparency and accessibility. Initial Exchange Offering (IEO): An IEO, on the other hand, is managed by a cryptocurrency exchange. The exchange acts as a trusted intermediary, conducting the token sale on behalf of the company. This method adds a layer of credibility, as exchanges usually vet the projects before listing them. The Differences: Simplified Platform: ICOs are often hosted on the project’s own website, IDOs on decentralized exchanges, and IEOs on centralized exchanges. Trust Level: ICOs rely heavily on the project’s reputation, IDOs offer some transparency via smart contracts, and IEOs provide additional trust as exchanges vet the projects. Ease of Participation: ICOs can be more accessible to a wider audience, IDOs require some knowledge of using decentralized exchanges, and IEOs are user-friendly but may require account verification on the exchange. A Brief History: The Rise and Fall ICO Boom of 2017: The year 2017 was the golden era for ICOs. Hundreds of projects raised billions of dollars from investors eager to get in on the next big thing in crypto. The allure was high returns on investment, similar to buying shares in a company before it goes public. However, this gold rush had its pitfalls. Many projects either failed to deliver on their promises or turned out to be outright scams. This led to significant financial losses for investors and skepticism towards ICOs. Shift to IDOs and IEOs: In response to the shortcomings of ICOs, the crypto world saw the emergence of IDOs and IEOs. IDOs, with their decentralized nature, provided more transparency, while IEOs offered an additional layer of security through exchange vetting. Impact and Current Usage ICOs: Due to regulatory crackdowns and the high risk of scams, ICOs have become less popular. However, they paved the way for innovative fundraising methods in the crypto space. IDOs: IDOs are gaining traction due to their decentralized and transparent nature. They allow projects to reach a wide audience without relying on a centralized platform. IEOs: IEOs are currently more popular than ICOs, thanks to the added trust from established exchanges. They provide a safer environment for both projects and investors. Failed ICOs of 2017: Lessons Learned Tezos:The Tezos Initial Coin Offering (ICO) in 2017 was one of the most notable in the cryptocurrency space, raising a staggering $232 million. However, this success was marred by significant internal conflicts and legal issues, leading to substantial delays and investor frustration.Initial Success and Vision: Tezos was envisioned as a self-amending blockchain platform, aiming to offer superior governance and upgradeability compared to other blockchain projects. The ICO, which took place in July 2017, was a massive success, accumulating about 66,000 Bitcoins and 361,000 Ethers in just 13 days.Internal Conflicts and Legal Battles: The problems began shortly after the ICO concluded. The relationship between the founders, Arthur and Kathleen Breitman, and the president of the Tezos Foundation, Johann Gevers, became strained. Disputes over the control and management of the funds and the project itself led to significant delays in the token distribution. This internal conflict escalated to the point where both parties accused each other of unethical behavior, further complicating the project’s progress. In addition to internal strife, Tezos faced multiple class-action lawsuits in the United States. The lawsuits claimed that Tezos had conducted an unregistered securities offering, violating SEC regulations. These legal challenges added another layer of complexity and delayed the project’s development further. Sirin Labs: Sirin Labs raised $158 million to create the Finney blockchain smartphone. The ambitious project aimed to revolutionize mobile technology but failed to gain market traction. Production issues and a lack of consumer interest led to substantial losses. Bancor: Bancor launched its Initial Coin Offering (ICO) in June 2017, raising an impressive $153 million within a few hours. The project aimed to create a decentralized liquidity network that allowed users to convert different cryptocurrencies without needing an exchange. This innovative concept quickly garnered attention, positioning Bancor as a pioneer in the decentralized finance (DeFi) space.However, Bancor faced significant challenges shortly after its successful ICO. In 2018, the platform experienced a major security breach where hackers stole approximately $13.5 million worth of tokens. This incident raised serious concerns about the platform’s security and shook investor confidence. Additionally, regulatory issues in 2019 forced Bancor to bar U.S. users from its platform, further complicating its operations and affecting its market presence.Current Status and Innovations: Despite these setbacks, Bancor has managed to adapt and evolve. The project continues to operate and has introduced several innovative features aimed at enhancing its utility and security in the DeFi ecosystem. One of its notable advancements is the Carbon protocol, which enables users to execute automated trading strategies directly on the blockchain. This protocol is designed to resist common DeFi exploits such as Miner Extractable Value (MEV) sandwich attacks, providing a more secure trading environment.Moreover, Bancor’s governance model, operated through the BancorDAO, ensures that changes to the protocol are made transparently and democratically, involving the
The Ripple Effect: How News Impacts the Crypto Market

The Impact of News on the Cryptocurrency Market Imagine the cryptocurrency market as a vast ocean, with investors as surfers riding the unpredictable waves. News, in this analogy, acts as the wind—sometimes a gentle breeze, sometimes a violent storm—shaping the size and intensity of the waves. In the cryptocurrency world, where prices can soar or plummet within minutes, understanding how news influences the market is crucial for anyone looking to navigate these turbulent waters. This essay explores the profound impact of news on the crypto market, delving into five significant news events and their repercussions on prices. We will also unpack the phenomenon of “sell the news,” a strategy where large investors, or “whales,” capitalize on market hype. The Double-Edged Sword of News News can be both a boon and a bane for the crypto market. Positive news (like interest rate cut) can drive investor confidence, leading to price surges, while negative news can trigger panic selling and steep declines. The rapid dissemination of information in today’s digital age means that the crypto market is highly sensitive to news events, with prices reacting almost instantaneously. Case Study 1: Tesla’s Bitcoin Investment On 08 February 2021, Tesla announced it had purchased $1.5 billion worth of Bitcoin and planned to accept it as payment for its electric cars. This news was a significant endorsement of Bitcoin’s legitimacy and potential as a mainstream financial asset. Following the announcement, Bitcoin’s price soared from around $38,000 to a peak of nearly $46,700 in a day. This was surge of $8,000 dollar within a day. In next few days it soared to $58,000. Impact on Prices: Before Announcement: ~$38,000 After Announcement: ~$58,000 The news led to a massive influx of retail and institutional investors, driving up demand and prices. However, this surge was also accompanied by increased volatility as traders speculated on future price movements. Case Study 2: China’s Crackdown on Cryptocurrencies In May 2021, China announced a sweeping crackdown on cryptocurrency mining and trading. The news sent shockwaves through the market, leading to a significant sell-off. Bitcoin’s price, which had been hovering around $55,000, plummeted to below $30,000 within weeks. Impact on Prices: Before Announcement: ~$55,000 After Announcement: ~$30,000 China’s announcement underscored the impact that regulatory news can have on the crypto market. The fear of further crackdowns led to a mass exodus of miners from China and significant price volatility. Here, we must note that according to some analysts China never completely banned cryptocurrencies in its main land and that’s why the Chinese trading on Binance is exceeding $90B. Case Study 3: El Salvador Adopts Bitcoin as Legal Tender On June 09, 2021, El Salvador became the first country to adopt Bitcoin as legal tender. This historic decision was hailed as a milestone for Bitcoin’s adoption. The news initially caused Bitcoin’s price to surge from around $33,500 to over $41,000. However, implementation challenges and skepticism from international financial institutions led to a price drop shortly after. Impact on Prices: Before Announcement: ~$33,500 After Initial Surge: ~$41,000 After Implementation Challenges: ~$28,000 This case highlights how positive news can boost prices, but also how subsequent developments and uncertainties can temper initial enthusiasm. Let us tell you something. When El Salvador first bought 200 Bitcoin in September 2021, the IMF’s reaction was harsh, causing the price to drop quickly within an hour. At around $43,000, President Nayib Bukele announced that they had purchased an additional 200 Bitcoin at discounted prices. This move stopped the rapid decline in price. It appears that there was some questionable financial maneuvering against the country for making Bitcoin legal tender instead of the dollar. Case Study 4: SEC’s Approval of Bitcoin Futures ETF In October 2021, the U.S. Securities and Exchange Commission (SEC) approved the first Bitcoin futures ETF (Exchange-Traded Fund). This news was seen as a major step towards mainstream acceptance of Bitcoin and other cryptocurrencies. Bitcoin’s price jumped from around $57,000 to a high of $69,000 (that time’s ATH) following the announcement. Impact on Prices: Before Announcement: ~$57,000 After Announcement: ~$69,000 The approval of the ETF attracted a wave of new investors, reflecting the growing integration of cryptocurrencies into traditional financial markets. Case Study 5: FTX Collapse and Market Crash In November 2022, the collapse of FTX, one of the largest cryptocurrency exchanges, triggered a market-wide crash. The news led to widespread panic and a sharp decline in prices. Bitcoin’s price fell from around $21,000 to below $16,000, with other cryptocurrencies experiencing similar declines. Impact on Prices: Before Collapse: ~$21,000 After Collapse: ~$16,000 The FTX collapse underscored the vulnerabilities in the crypto market and the importance of robust infrastructure and regulatory oversight. The “Sell the News” Phenomenon The concept of “sell the news” is a strategy where large investors, often referred to as “whales,” capitalize on market hype generated by positive news. Whales are investors with substantial holdings, capable of influencing market prices through their trading activities. Here’s how “sell the news” typically plays out: Positive News Announcement: A piece of positive news, such as a major company investing in Bitcoin or a favorable regulatory decision, generates excitement and optimism in the market. Price Surge: Retail investors and smaller traders, motivated by the positive news, start buying, driving up the price. Whales Sell: As the price peaks due to the influx of buyers, whales begin to sell their holdings. Because whales hold large amounts of cryptocurrency, their selling can create significant downward pressure on prices. Market Correction: Once the whales have sold their holdings, the market often experiences a correction, with prices falling from their highs. This strategy leverages the psychological impact of news on retail investors, who often act on emotion and herd behavior. By selling into the hype, whales can secure profits before the market corrects itself. Example of “Sell the News” A notable example of “sell the news” occurred in the aftermath of the Tesla Bitcoin announcement. While the initial news drove prices up significantly, subsequent sales by large investors led to a correction. The price
Profits with Order Blocks: A Guide to Strategic Trading

Imagine you’re at a bustling farmers’ market on a Saturday morning. Each vendor has a unique spot where they sell their goods, and regular customers know exactly where to go to get the best deals. In the world of trading, an “order block” is a bit like these regular vendor spots—it’s a place on a price chart where significant buying or selling activity has taken place. Understanding order blocks can help traders predict where prices might move next, just like knowing which vendors offer the best deals can make your market trip more efficient. What is an Order Block? In simple terms, an order block is a zone on a trading chart where big institutions, like banks or hedge funds, have placed large buy or sell orders. These blocks indicate areas of strong support or resistance. Think of it as a footprint left behind by big players in the market. When these institutions buy or sell in large quantities, they leave a mark on the price chart, which traders can use to their advantage. Order blocks are shown on charts as points with multiple bounce backs (as shown in image below). They are not just random occurrences; they represent a concerted effort by major players to buy or sell at specific price levels. This activity often creates a kind of “memory” in the market. Traders can look at these historical levels to gauge future price movements. In this chart, you can see two boxes: green and red. The green box represents a range from which the price usually bounces. This acts similarly to a support level but covers a wider range. When the price reached this range in the past, buying orders countered the selling pressure, causing the price to rise from this point. It is likely that the same situation will occur when the price reaches this range again, as traders who have observed this level will place buy orders here. The same principle applies to the red box, which indicates a selling point. When the price reached this level previously, numerous selling orders forced it to go back down. It is likely that this scenario will repeat next time. Note that each support, resistance, trend, and order block eventually breaks. If this were not the case, the market would always move sideways and fade away due to squeezing movements. For example, if someone bought at $60,000 and sold at $71,000, they might try to buy at $61,000 the next time to avoid missing out if the price doesn’t drop to $60,000 again, and they might aim to sell at $70,000 to avoid rejection. This behavior squeezes the price, eventually causing it to stop moving. Thus, every block breaks in the end, marking the beginning of a new trend. Why Do Order Blocks Matter? Order blocks matter because they can signal potential price reversals or continuations. For instance, if a large institution buys a significant amount of a stock at a certain price level, that level becomes a strong support area. If the price drops to that level again, other traders might expect it to bounce back up, creating a buying opportunity. Conversely, if a large institution sells a lot at a certain price, that level becomes a resistance area. If the price climbs back to that level, traders might expect it to fall again, creating a selling opportunity. Order blocks provide a sort of roadmap for traders. By recognizing where large orders have previously been placed, traders can anticipate where future support and resistance levels might be. This understanding can lead to more strategic trading decisions and better risk management. Spotting Order Blocks on a Chart Let’s break down how you can spot order blocks on a chart: Identify Strong Price Movements: Look for areas on the chart where the price has moved sharply up or down. These strong moves often indicate the presence of large orders from institutions (see image above). Look for Consolidation Areas: Before a strong move, prices often consolidate or move sideways. This consolidation phase is where institutions might be placing their orders quietly but this is not the case always. Check Volume: High trading volume during these periods of consolidation can be a clue that big players are involved. When volume spikes, it often indicates that significant buying or selling is taking place. This is not necessary for each bounce. Observe Price Reactions: Notice how prices react when they revisit these areas. If prices tend to bounce back up from a specific level repeatedly, it suggests a buy order block. If they fall from a level repeatedly, it indicates a sell order block. Real-World Example: The Farmers’ Market Analogy Imagine you’re at the farmers’ market, and there’s a particular stall that always has fresh apples. One day, you notice that the vendor has put up a big sign saying “Fresh Apples, Limited Stock!” and there’s a rush of customers buying apples. The next week, you come back and see that the vendor has put up the same sign again, and once more, people are rushing to buy. In trading terms, that vendor’s spot is an order block. The vendor (like a big institution) creates significant buying activity at that spot, and the customers (like traders) recognize this and follow suit. They know that when the vendor signals fresh apples, it’s time to buy. Similarly, if another vendor has a surplus of oranges and slashes prices to sell quickly, you’ll notice a surge in buying activity. Next time you see those low prices, you might anticipate another rush. This mirrors how sell order blocks function in trading. How to Use Order Blocks in Trading Now that you understand what order blocks are, here’s how you can use them in your trading strategy: Set Entry and Exit Points: Use order blocks to set your entry and exit points. If you identify a buy order block, you might set a buy order just above this level. Conversely, if you identify a sell order block, you
The Merger of AI Giants: An Exploration of FET, OCEAN and AGIX merger to ASI

AI or Artificial Intelligence has rapidly evolved from a concept in science fiction to a transformative force across various industries. It refers to the capability of machines to mimic human intelligence, performing tasks like learning, problem-solving, and decision-making. AI’s applications range from virtual assistants like Siri and Alexa to complex systems managing logistics, finance, and healthcare. The Evolution of AI The journey of AI began in the mid-20th century with pioneers like Alan Turing, who questioned whether machines could think. Early AI research focused on symbolic reasoning and problem-solving. The 1980s saw the rise of machine learning, where computers learned from data rather than being explicitly programmed. The advent of deep learning in the 2010s, fueled by big data and powerful computing, has led to significant breakthroughs, making AI more efficient and accessible. Major AI Projects and Their Services Several notable AI projects have made significant impacts: IBM Watson: Known for winning “Jeopardy!”, Watson has applications in healthcare for diagnosing diseases and in customer service for automating responses. Google DeepMind: Famous for developing AlphaGo, which defeated the world champion Go player, DeepMind focuses on reinforcement learning and has applications in energy efficiency and healthcare. OpenAI: Creator of GPT-3, OpenAI’s models are used in language processing, from chatbots to creative writing assistance. AI in Crypto and Web 3 The integration of AI with blockchain technology, often referred to as AI in crypto or Web 3, represents a fusion of intelligent decision-making with decentralized networks. This combination enhances transparency, security, and efficiency. In Web 3, AI can automate and optimize decentralized finance (DeFi) protocols, enhance smart contracts, and manage supply chains more effectively. The Future of AI in Crypto AI’s role in crypto is set to expand as it can bring advanced analytics and automation to blockchain networks. By integrating AI, blockchain platforms can offer more robust solutions for fraud detection, predictive analytics, and autonomous decision-making. This synergy promises to drive innovations in various sectors, from finance to logistics. Overview of FET, OCEAN, AGIX, and ASI Tokens Fetch.ai (FET) Fetch.ai combines blockchain with AI to create a decentralized digital economy. It uses autonomous agents that perform tasks such as data sharing, process optimization, and transaction execution without human intervention. These agents are particularly useful in logistics, smart cities, and energy management. Imagine a city where traffic lights can adjust in real-time based on current traffic conditions, emergency vehicles get automatic green lights to save lives, and electric cars find the nearest charging station. Fetch.ai’s agents could manage all these tasks autonomously, ensuring efficiency and reducing human error. Ocean Protocol (OCEAN) Ocean Protocol aims to unlock data for AI consumption by creating a decentralized data exchange. It allows data providers to monetize their data while ensuring privacy and control. The Ocean token is used for buying and selling data, incentivizing data sharing, and participating in governance. For instance, a healthcare provider could share anonymized patient data on the Ocean Protocol, allowing AI researchers to develop better diagnostic tools while keeping patient information secure and private. This way, vital medical advancements can be made without compromising confidentiality. SingularityNET (AGIX) SingularityNET is a decentralized marketplace for AI services. It enables developers to publish, share, and monetize their AI algorithms, while users can purchase these services using AGIX tokens. This platform fosters collaboration among AI researchers and developers, democratizing access to AI technologies. Imagine a small business wanting to use AI to analyse customer feedback. They can purchase a sentiment analysis service from SingularityNET without needing to develop the AI themselves, making advanced technology accessible to everyone. Artificial Superintelligence (ASI) ASI token is part of the Superintelligence Alliance, a collaboration between Fetch.ai, SingularityNET, and Ocean Protocol. This alliance aims to consolidate their AI capabilities and create a universal AI token to streamline AI services and foster a cohesive AI ecosystem. Consider an AI-powered global supply chain where Fetch.ai’s agents optimize logistics, Ocean Protocol provides the necessary data, and SingularityNET offers specialized AI services for demand forecasting and inventory management. The ASI token would facilitate transactions and integration across this unified ecosystem. The Merger and Its Importance The merger between Fetch.ai, SingularityNET, and Ocean Protocol to create the Artificial Superintelligence Alliance is a significant step towards a unified AI-driven blockchain ecosystem. This merger aims to integrate their technologies and resources, creating a powerful platform for decentralized AI applications. The ASI token will serve as the universal currency within this ecosystem, facilitating seamless interactions and transactions between the integrated platforms. The Future of the ASI Project The future of the ASI project looks promising, with potential applications in numerous sectors such as finance, healthcare, and logistics. By leveraging the combined expertise of Fetch.ai, SingularityNET, and Ocean Protocol, the ASI project can drive innovation and efficiency in AI applications. The merged platform is expected to enhance data sharing, improve AI service accessibility, and streamline complex processes across various industries. Understanding Total Supply of Tokens According to CoinMarketCap: ASI (the new token) will have a total supply of about 2.63 billion tokens. FET has a total supply of 2.63 billion tokens. OCEAN has a total supply of 1.4 billion tokens. AGIX has a total supply of 2 billion tokens. When you add up the total supply of FET, OCEAN, and AGIX, you get approximately 6.03 billion tokens. The total supply of ASI will be 56% less than this combined total. While this figure is not officially confirmed, it is publicly available information. Implications of Decreasing Supply and Future Price With a lower supply of ASI compared to the combined supply of FET, OCEAN, and AGIX, and considering the combined services these tokens provide, there’s a potential for ASI to become very valuable. The ASI token might even be worth double the value of FET. This is because the team and Binance has announced that FET holders will receive ASI on a 1:1 ratio, meaning if you hold 1 FET, you get 1 ASI. This consolidation (bringing together different tokens into ASI) aims to create a strong and efficient token
Crypto Trends Unveiled: A Beginner’s Guide to Market Movements

Imagine you’re standing at the edge of a vast, bustling marketplace. This marketplace is unlike any other—it doesn’t sell fruits, clothes, or gadgets. Instead, it’s a marketplace for digital currencies, commonly known as cryptocurrencies. The hustle and bustle here are driven by numbers on screens, fluctuating up and down, indicating the value of these cryptocurrencies like Bitcoin and Ethereum. This dynamic environment is what we call the crypto market, and it’s constantly changing, influenced by various trends. What Are Crypto Market Trends? Just like waves in the ocean, the value of cryptocurrencies (or any other financial market, like stocks, commodities, forex etc) rises and falls, creating trends. These trends are essentially the general direction in which the market moves over a period. If you see prices steadily increasing, that’s an upward trend. Conversely, if prices are falling, that’s a downward trend. Understanding these trends helps investors decide when to buy or sell cryptocurrencies. How Are Trends Measured? To make sense of the seemingly random movements in the crypto market, traders use different tools and techniques. Think of these as different types of glasses that help you see the waves more clearly. Let’s look at a few of these tools: SMA, EMA, HMA, and VWMA. We will discuss them separately too. Simple Moving Average (SMA): Imagine you want to know the average temperature in your city over the last week. You’d add up each day’s temperature and divide by seven. That’s essentially what the SMA does with cryptocurrency prices. It takes the average price over a specific number of days. For example, a 10-day SMA adds up the prices of the last 10 days and divides by 10. This helps smooth out daily fluctuations and shows the overall trend. Exponential Moving Average (EMA): The EMA is like the SMA but gives more importance to recent prices. It’s like if you weighed the temperature of the last three days more heavily than the first four days. This makes the EMA more responsive to recent changes in the market, helping traders catch trends earlier. Hull Moving Average (HMA): The HMA goes a step further, aiming to reduce the lag in moving averages. It’s a bit more complex, but you can think of it as a more agile and responsive version of the SMA and EMA. It reacts quickly to changes in price, helping traders spot trends sooner. In our experience it is more responsive to changes than other three. Volume-Weighted Moving Average (VWMA): The VWMA adds another layer by considering the volume of trades. Imagine you’re tracking the popularity of ice cream flavors by not just counting the number of scoops sold but also noting which flavors sold in bulk. The VWMA takes the average price but gives more weight to prices during high trading volumes, offering a clearer picture of where the most activity is. NOTE THAT: In crypto market Moving Average is a LAGGING indicators which means it indicates trend a little late, normally after one or two days. This is because it comes from stocks and forex which are much slower than crypto. So relying heavily on it can result losses. What Starts Trends? Trends in the crypto market can start due to a variety of factors. Here are a few common ones: News and Events: Just like a rumor can spread quickly in a small town, news about cryptocurrencies can significantly impact their prices. Positive news, like a major company accepting Bitcoin, can start an upward trend. Negative news, such as a country banning crypto trading, can trigger a downward trend. Market Sentiment: The general feeling or mood among traders can influence trends. If traders feel optimistic about the market (bullish), they’re likely to buy more, driving prices up. If they’re pessimistic (bearish), they might sell off, causing prices to drop. Technological Developments: Innovations and improvements in blockchain technology, which underpins cryptocurrencies, can also affect trends. A major upgrade to the Bitcoin network, for example, might make it more efficient and secure, leading to a price increase. Regulatory Changes: Governments around the world are still figuring out how to regulate cryptocurrencies. New regulations can have a big impact. Clear, favorable regulations might boost confidence and drive prices up, while strict regulations might have the opposite effect. Conclusion Understanding trends in the crypto market is like learning to read the waves in our bustling marketplace. Tools like SMA, EMA, HMA, and VWMA help traders see the bigger picture and make informed decisions. Trends can start due to news, market sentiment, technological advancements, and regulatory changes. For anyone venturing into the world of cryptocurrencies, keeping an eye on these trends is essential. So, next time you hear about the rise or fall of Bitcoin, you’ll have a better idea of what’s driving those changes and how traders are navigating the ever-changing tides of the crypto market.
Exchanges: A Beginner’s Guide to Cryptocurrency Trading

Imagine you live in a small town where everyone loves to trade goods. In this town, there are two main marketplaces: one is a big, organized store run by a group of managers, and the other is an open field where people trade freely with each other. These two marketplaces represent centralized and decentralized exchanges in the world of cryptocurrency. Centralized Exchanges: The Organized Store Centralized exchanges (CEX) are like the big, organized store. In this store, a team of managers oversees everything. They set the rules, ensure security, and help you find what you need. When you want to trade, you give your goods (or money) to the store, and they handle the trade for you. How It Works: Account Creation: Just like you’d sign up for a membership at the store, you create an account on a centralized exchange, like Binance, OKex, Kucoin, Bitget, Bybit and MEXC etc. You can create account on Binance here. Depositing Funds: You deposit your money or cryptocurrency into the exchange’s account, similar to how you might put your money in the store’s safe deposit box. Trading: The exchange matches buyers and sellers. If you want to buy some cryptocurrency, the exchange finds someone who wants to sell and completes the trade for you. Withdrawal: Once you’re done trading, you can withdraw your funds back to your personal account. Advantages: User-Friendly: Centralized exchanges are usually very easy to use. They offer customer support, clear interfaces, and help with transactions. Security and Trust: These exchanges invest heavily in security to protect users’ funds and have insurance in case something goes wrong. Liquidity: There are often many people trading on these platforms, making it easier to buy or sell quickly. Disadvantages: Control: You don’t have complete control over your funds because they are held by the exchange. Privacy: You often need to provide personal information to use these platforms. Risk of Hacking: Even with strong security, centralized exchanges can be targets for hackers. Decentralized Exchanges: The Open Field Decentralized exchanges (DEX) are like the open field where people trade directly with each other. There are no managers or middlemen; you handle everything yourself. Some examples are uniswap, 1inch and pancakeswap. How It Works: No Account Needed: You don’t need to create an account. All you need is a digital wallet where you store your cryptocurrency, like trust wallet, exodus etc. Direct Trading: You trade directly with other people. Using smart contracts, which are self-executing agreements coded into the blockchain, trades are done automatically and securely. Maintaining Control: Your funds stay in your wallet until you decide to trade, so you have full control over your assets. Advantages: Control: You always control your funds and don’t have to trust a third party. Privacy: You don’t need to provide personal information to trade. Security: Since your funds aren’t stored on a central server, they are less vulnerable to large-scale hacks. Disadvantages: Complexity: Decentralized exchanges can be harder to use, especially for beginners. Liquidity Issues: There may be fewer people trading, which can make it harder to buy or sell quickly. Lack of Customer Support: If something goes wrong, there’s no customer service to help you. Blockchain relation: You can only trade on provided blockchains. If a token is on Ethereum you can not directly change it to BTC. Summary: Choosing Your Marketplace Both centralized and decentralized exchanges have their strengths and weaknesses. If you prefer ease of use, strong security measures, and customer support, centralized exchanges might be the way to go. Many people use CEX only. If you value privacy, control over your funds, and are comfortable with a bit more complexity, decentralized exchanges could be more appealing. In the end, the choice depends on your personal preferences and comfort level with handling digital assets. By understanding the differences between these two types of exchanges, you can make informed decisions about how to trade and manage your cryptocurrency. Happy trading!
Riding the Market Waves with RSI

Imagine you’re a surfer, standing on the shore, watching the waves crash and recede. You’re looking for the perfect moment to jump in, catch a wave, and ride it all the way to the shore. In the world of trading, the Relative Strength Index (RSI) is like your surfing guide, helping you identify those perfect moments when the market’s waves are just right for making your move. Understanding RSI: Your Market Surfing Guide RSI, or Relative Strength Index, is a popular tool among traders, used to measure the momentum of price changes. Think of it as a thermometer for the market’s fever. It tells you that how much price is strong relative to given number of candles. This nifty indicator oscillates between 0 and 100, providing insights into whether an asset is overbought or oversold, revealing potential reversals, and identifying trends. Let’s break down its three primary uses: Oversold and Overbought Conditions: Picture RSI as a pendulum. When it swings too high, above 70 (or in the case of the volatile crypto market, above 80 which we recommend), it signals that the asset might be overbought. This means the price could be higher than what the market considers fair, suggesting a potential drop ahead. Conversely, when the pendulum swings too low, below 30 (or below 20 for crypto), it indicates the asset might be oversold, meaning the price could be lower than its fair value, hinting at a potential rise. Divergence: Divergence is like noticing the wind changing direction while surfing. When the price of an asset moves in one direction and the RSI moves in another, it signals a potential reversal. For example, if prices are rising but RSI is falling, it might be a clue that the upward trend is losing strength and a downward shift could be imminent. Trend Identification: RSI also helps in spotting trends, much like a seasoned surfer reading the ocean waves. A consistently high RSI in the range of 50-70 (or 50-80 for crypto) during an uptrend or a low RSI in the range of 30-50 (or 20-50) during a downtrend can confirm the strength of the ongoing trend. Note these points again: RSI would be consistently HIGH WHEN overall trend is HIGH is uptrend and vice versa. So only high RSI in overall low trend is not indicating uptrend. Crypto Market: Adjusting the RSI Lens In the wild world of cryptocurrency, prices can change as rapidly as ocean waves during a storm. Because of this volatility, traders often adjust their RSI settings to better navigate these tumultuous waters. Instead of the traditional 70-30 thresholds, many use 80 for overbought and 20 for oversold conditions. This adjustment helps in filtering out the noise and focusing on more significant market signals. However, it’s crucial to remember that prices don’t always bounce immediately from these overbought or oversold regions. Sometimes, just like waiting for the right wave, you may need to exercise patience. The market can linger in these regions longer than anticipated, and immediate reversals are not guaranteed. Results can be better if RSI is used with MFI or Bollinger Bands. The Daily Timeframe: Your Go-To Window Among the various timeframes traders use, the daily timeframe is the most popular for RSI analysis. This period provides a balanced view, capturing enough data to smooth out short-term fluctuations while reflecting broader market trends. It’s akin to looking at the tide cycles rather than individual waves, giving a clearer picture of the overall market momentum. RSI Heatmaps: A Bird’s Eye View For those who like to keep an eye on multiple assets simultaneously, RSI heatmaps are invaluable tools. These heatmaps provide a visual representation of RSI levels across various cryptocurrencies at a glance, much like a weather map showing wave conditions across different beaches. With just a quick look, traders can spot which coins are entering overbought or oversold territories, helping them make more informed decisions quickly. Riding the Market Waves with RSI In summary, the Relative Strength Index is like your trusted surfboard, guiding you through the ups and downs of the trading ocean. By understanding and utilizing RSI, especially with adjusted thresholds for the volatile crypto market, traders can better identify overbought and oversold conditions, spot divergences, and confirm trends. Using the daily timeframe offers a balanced view of market momentum, and RSI heatmaps provide a comprehensive overview of multiple assets. Just as surfing requires practice, patience, and a keen eye on the waves, mastering RSI in trading involves similar dedication. By staying informed and vigilant, you can navigate the market’s waves with confidence and skill, making the most of every opportunity that comes your way. So, grab your surfboard, keep an eye on those RSI signals, and ride the market waves to your trading success.
How American Interest Rates Drive the Crypto Rollercoaster
Do you ever think why the price of cryptocurrencies, like Bitcoin, seems to be on a wild rollercoaster ride, going up and down with dizzying speed? To understand this, we need to take a closer look at something that might seem unrelated at first: American interest rates. Yes, those numbers set by the Federal Reserve can have a profound impact on the risky world of crypto markets. Let’s dive into the story of how this works. Setting the Stage: Interest Rates and Risk Interest rates, simply put, are the cost of borrowing money. When the Federal Reserve, often just called the Fed, raises or lowers these rates, it sends ripples through the entire financial world. Imagine you’re standing at the edge of a calm pond and you toss a stone into it. The splash creates waves that spread out in all directions. That’s what changing interest rates do to the economy. The Link Between Interest Rates and Investments When interest rates are low, borrowing money is cheaper. This encourages businesses to take loans for expansion and individuals to take loans for big purchases, like homes or cars. It also means savings accounts and other low-risk investments offer lower returns, nudging investors to look for higher returns elsewhere. This is where riskier investments, like stocks and cryptocurrencies, come into play. In contrast, when interest rates rise, borrowing becomes more expensive. This can slow down spending and borrowing, and suddenly those safe, low-yield investments look more attractive again. Investors might pull their money out of risky markets and put it into safer places. Cryptocurrencies: The High-Risk, High-Reward Frontier Cryptocurrencies are among the riskiest investments out there. They are not tied to any physical assets, governments, or traditional financial systems, which makes them highly volatile. This means their value can skyrocket or plummet in a very short period, driven by market sentiment, news, and, importantly, interest rates. When interest rates are low, as they have been in recent years, people are more willing to take risks. The potential for high returns in the crypto market becomes very attractive compared to the meager returns on safer investments. More money flows into cryptocurrencies, driving their prices up. The Ripple Effect of Rising Rates Now, let’s consider what happens when interest rates start to climb. As the Fed raises rates to control inflation and stabilize the economy, the environment for investments changes. Suddenly, those high-risk, high-reward crypto investments look a bit too risky compared to safer options that are starting to offer better returns. Investors may start to sell off their cryptocurrencies, leading to a drop in prices. This sell-off can create panic, causing even more people to sell and further driving down prices. It’s a cascading effect that can lead to significant declines in the crypto market. Real-World Examples We’ve seen this happen in recent years. For example, during periods when the Fed hinted at or actually increased interest rates, the crypto market experienced sharp declines. Investors moved their money into safer, more stable assets as the relative attractiveness of risky investments waned. On the flip side, when the Fed cut rates to near zero during the COVID-19 pandemic to stimulate the economy, we saw a surge in crypto investments. People were looking for better returns than what they could get from traditional savings accounts or bonds, which were offering very low yields due to the low interest rates. Conclusion: The Dance of Risk and Reward In essence, the relationship between American interest rates and the crypto market is a dance of risk and reward. When interest rates are low, the music favors high-risk, high-reward investments, and cryptocurrencies often take center stage. When rates rise, the music changes, and investors may shift their focus to safer, more predictable returns. Understanding this dynamic helps us make sense of the seemingly chaotic movements in the crypto market. It’s a reminder that in the world of finance, everything is interconnected. The next time you see headlines about interest rate changes, remember that these shifts can have a ripple effect far beyond traditional investments, influencing even the most modern and volatile markets like cryptocurrency. So, whether you’re a seasoned investor or just curious about the financial world, keeping an eye on interest rates is always a good idea.
