
Victory Beyond Fear? Understanding the Fear and Greed Index
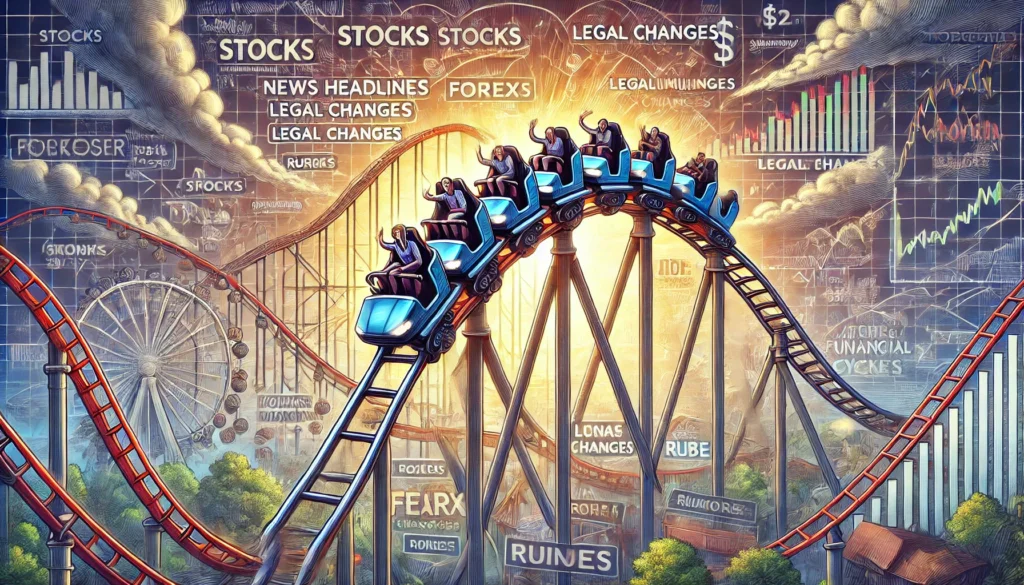
Imagine you’re at an amusement park, standing in line for a roller coaster. As the ride begins, the car climbs slowly to great heights, and then suddenly plunges back down at breakneck speed. The feelings of anticipation and fear are palpable. This roller coaster ride is a lot like the financial markets: sometimes they’re climbing high, tempting traders with greed, and other times they’re plunging down, filled with fear. Financial markets, whether they’re stocks, forex, commodities, or cryptocurrencies, move in cycles. They rise, stay flat, or fall. These cycles can be influenced by news, legal changes, or even rumors. We have discussed cycles and ATH, ATL made by them here. But regardless of the cause, these cycles always reflect two emotions in the market: fear and greed. Understanding the Fear and Greed Index in Crypto The Fear and Greed Index is a tool used to gauge the emotions of traders in the cryptocurrency market, specifically Bitcoin. This index ranges from 0 to 100. A score from 0 to 25 indicates extreme fear, 25 to 50 shows fear, 50 to 75 represents greed, and 75 to 100 indicates extreme greed. Some platforms consider a score around 50 as neutral. When greed is high, and the index is high, more people are eager to invest. Unfortunately, many investors try to jump on the bandwagon, buying at high prices and driving prices even higher. Conversely, when the index is low, indicating fear, most people are fleeing the market, selling off their assets at a loss. Large investors, known as whales, often take advantage of these situations by buying during times of fear and selling during times of greed. This buying during fear is called “accumulation,” and selling during greed is called “distribution.” Impact of News on Market Sentiment Positive or negative news significantly influences market sentiment and direction. Good news, like legal approvals or major partnerships, creates positive sentiment, leading to more buying and pushing the Fear and Greed Index up. On the other hand, bad news, like government crackdowns, instills fear, causing the index to drop. Examples of Greed-Driven and Fear-Driven News In October 2021, the approval of Bitcoin futures ETFs in the U.S. pushed Bitcoin’s price above $66,000, with the Fear and Greed Index hitting 84. Investors rushed to buy, driving Bitcoin on Binance to an all-time high of $69,000. However, highs driven by greed are often temporary, and prices soon began to decline. Conversely, in May 2021, China’s ban on crypto trading and mining led to a sharp price crash in Bitcoin, spreading fear across the market and dropping the Fear and Greed Index to 10. Although the market recovered in a few months, this event highlighted the impact of negative news on market sentiment. Not Every News Has an Impact We’ve explained the effects of news on the market in detail in this article. However, it’s important to remember that not every positive or negative news affects the market. In such cases, the Fear and Greed Index also shows no significant change. Here are some scenarios where news might not have an impact: Priced In: Sometimes investors expect the news beforehand and have already made their buying or selling decisions. In this case, the news only confirms their expectations, and its impact is very limited. This is known as the news being “priced in.” For example, the 2024 Bitcoin halving news had already created a high in the market well before the actual halving occurred. Repeated News: If the same type of news is seen repeatedly, its impact diminishes. When the U.S. Securities and Exchange Commission (SEC) initially banned Ripple (XRP), it had a significant effect. However, as the SEC continued to take similar actions against different coins, the market impact gradually lessened. Counteracting Sentiment: Sometimes, the market is experiencing strong emotions. For instance, if the market is in a state of extreme greed and a not-so-significant negative news item appears, its impact is quickly neutralized, and the market continues on its path. What are “Paper Hands” and “Diamond Hands”? When discussing the Fear and Greed Index, it’s essential to understand two other terms in the crypto market: “Paper Hands” and “Diamond Hands.” Paper Hands refer to traders who can’t handle any market pressure. As soon as there is any sign of trouble, they sell off their assets, often adding to the market’s fear and typically incurring losses. These traders are also known as “panic sellers.” Diamond Hands are those who take a long-term view and make decisions accordingly. They do not sell during periods of fear and sometimes even buy during these times. They usually benefit from the market in the long run by holding onto their investments. Limitations of the Fear and Greed Index Like any indicator, the Fear and Greed Index has its limitations. It moves with Bitcoin’s price and shows whether the market is in fear or greed after the movement has occurred. When the market drops sharply, the index also drops but then recovers with a short-term market recovery. When the market drops again, the index shows fear once more, even if the price is lower than before. For example, on May 24, 2021, Bitcoin’s price was around $35,600, and the Fear and Greed Index was 10. The price recovered afterward, but on June 22, 2021, the price was around $31,300, and the index was again 10. Later, on July 29, 2021, the price was around $29,775, and the index was still 10. This shows that the index does not give perfect results, much like other indicators. Its job is to indicate fear and greed, not predict price movements. Therefore, when using this index for long-term purposes, it should be used alongside other fundamental factors and macroeconomic conditions. Controlling Emotions in the Crypto Market Given the rapid changes in the crypto market, controlling emotions is more crucial here than in any other market. Here are some tips to help you manage your emotions in an environment filled with fear and greed: Stick to
Bitcoin All Time High (ATH): Navigating the Cycles of Crypto Markets
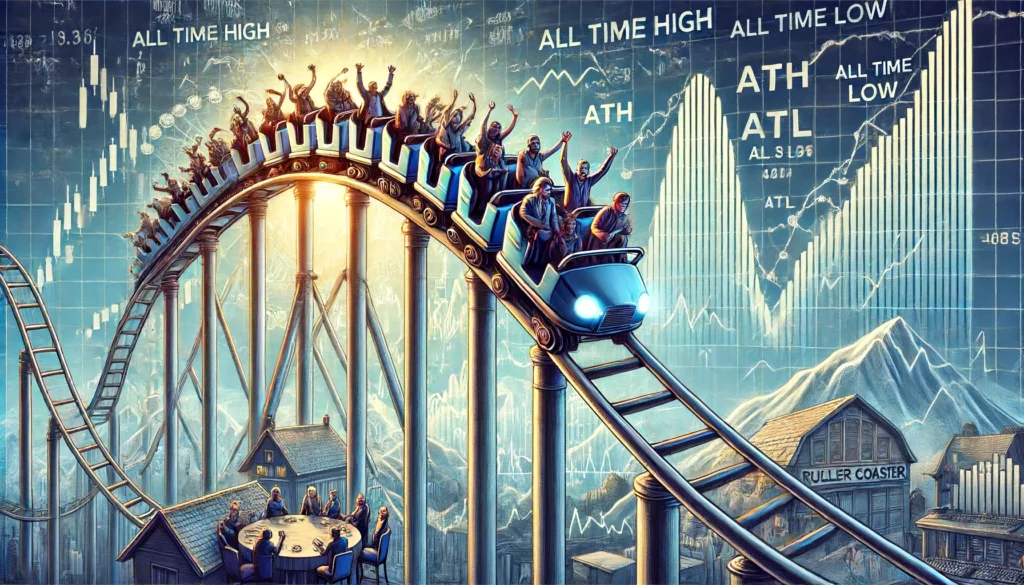
Riding the Financial Roller Coaster: Understanding Market Cycles Did you ever wonder why Bitcoin makes all time high (ATH) and all time low (ATL)? Why it does not go straight to upside? Imagine standing in line for a roller coaster. As you watch, the cars climb steep hills, crest at dizzying heights, and then plummet into deep valleys. Your anticipation builds with each scream of excitement and terror from the riders. Now, consider the financial markets as that roller coaster, constantly cycling through thrilling peaks and terrifying drops. Understanding these market cycles can make the ride less daunting and more profitable, helping you make informed investment decisions. The Fundamentals of Financial Market Cycles Financial markets, including stocks, bonds, and cryptocurrencies, operate in cycles. These cycles consist of periods of expansion and growth (bull markets) followed by periods of contraction and decline (bear markets). The movement of these cycles is influenced by various factors, such as economic conditions, global events, wars, and changes in interest rates. For instance, let’s look at the period between 2022 and 2023, when the interest rate in the United States climbed to 5.5%. This increase had a substantial negative impact on all financial markets. The reason is simple: higher interest rates make saving money in the bank more attractive because of the increased returns, leading investors to pull money out of riskier investments like stocks and cryptocurrencies. Moreover, higher borrowing costs due to increased interest rates can stifle companies’ growth and investment plans, adversely affecting their balance sheets and stock prices. The Impact of Interest Rates on Financial Markets To understand the impact of interest rates, imagine you’re running a business. When interest rates are low, you can borrow money at a lower cost to expand your operations, hire more staff, and invest in new technology. These activities typically lead to higher profits and, consequently, a rising stock price. However, when interest rates rise, borrowing becomes more expensive. You might have to cut back on expansion plans and investments, which can result in lower profits and a declining stock price. This relationship is why investors closely monitor interest rate changes. A hike in interest rates generally signals a more challenging environment for businesses, leading to a decline in stock prices and the onset of a bear market. Conversely, when interest rates fall, it can stimulate economic activity and lead to a bull market. The Cyclical Nature of Bitcoin and Cryptocurrencies Bitcoin, the pioneering cryptocurrency, also follows cyclical patterns, albeit over a shorter history compared to traditional financial markets. Bitcoin’s cycle typically spans four years and includes a year of rapid growth (bull run), a year of decline (bear market), and two years of recovery and stabilization. A crucial event in Bitcoin’s cycle is “halving,” which occurs approximately every four years. During a halving event, the reward for mining new Bitcoin blocks is halved, effectively reducing the supply of new Bitcoins. This scarcity often triggers a bull run, but significant price increases usually start a few months after the halving. However, other factors can also influence Bitcoin’s price. For example, in 2022, when Russia invaded Ukraine, Bitcoin, like other risky assets, experienced a sharp decline. This drop coincided with a bear market year for Bitcoin, highlighting how various factors can simultaneously impact market cycles. Real-World Examples: The Cyclical Nature of Bitcoin and Cryptocurrencies The 2013 Cycle and first all time high (ATH) In 2013, Bitcoin went through one of its first significant bull runs. At the beginning of the year, Bitcoin was trading at around $13. By April, it had surged to over $260, marking a substantial increase. This growth was driven by increasing media coverage and growing interest in cryptocurrencies. However, this rapid rise was followed by a sharp decline, with Bitcoin prices falling back to around $50 by mid-year. The market then entered a second bull phase, and by the end of 2013, Bitcoin reached a new all-time high of around $1,150 before entering a bear market. The 2017 Cycle The 2017 Bitcoin cycle is one of the most well-known in the cryptoverse. Bitcoin started the year at approximately $1,000 and experienced an explosive bull run, reaching an all-time high of nearly $20,000 in December. This surge was fueled by increased adoption, the launch of Bitcoin futures markets, and a frenzy of retail investor interest. However, this peak was short-lived, and Bitcoin entered a prolonged bear market in 2018, with prices dropping to around $3,200 by December 2018. The subsequent recovery phase saw Bitcoin stabilizing and slowly regaining value over the next two years. The 2020-2021 Cycle Bitcoin’s most recent cycle began in 2020. The COVID-19 pandemic initially caused a sharp decline in Bitcoin’s price, with a drop to around $4,000 in March 2020. However, as governments around the world implemented stimulus measures and interest rates were slashed, investors sought out alternative assets, leading to a significant bull run. By December 2020, Bitcoin had surpassed its previous all-time high, and by April 2021, it reached a new peak of around $64,000. This bull run was driven by several factors: increased institutional adoption (with companies like Tesla and MicroStrategy investing heavily in Bitcoin), growing acceptance as a store of value, and widespread media coverage. However, by mid-2021, Bitcoin experienced a sharp correction, dropping to around $30,000. Factors contributing to this decline included regulatory concerns in China, which cracked down on cryptocurrency mining and trading, and environmental concerns about Bitcoin’s energy usage. After this correction the second bull began and price surged to $69,000 before bear market started. The Influence of External Events As mentioned earlier, Bitcoin’s price is not only influenced by internal factors like halving but also by external events. The 2022 Russian invasion of Ukraine is a prime example. When the conflict began, global financial markets, including cryptocurrencies, experienced significant volatility. Investors typically react to such geopolitical tensions by moving away from riskier assets, and Bitcoin was no exception. This led to a sharp decline in Bitcoin’s price, further exacerbating the bear market
Trading’s Vital Pause: A most forgotten thing

Do you know what a trader miss most in trading? The importance of trading break. Imagine a car running nonstop, day in and day out, without ever turning off the engine. Over time, that car would start to show signs of wear and tear. The engine might overheat, the tires would wear down, and eventually, the car would break down completely. This scenario is not unlike what happens to our minds and bodies when we don’t take breaks, especially in high-pressure environments like trading. The Trading Treadmill Trading in financial markets is often described as a high-stakes game. The constant need to monitor markets, make quick decisions, and handle significant financial risks can be incredibly stressful. Imagine being on a treadmill that never stops, and every decision you make can lead to substantial gains or losses. The pressure to perform, the uncertainty, and the fear of making mistakes can take a heavy toll on your mental health. Over time, this can lead to burnout, anxiety, and even depression. The Importance of Taking a Break Just like any other high-stress job, the importance of trading break is high to maintain mental health and overall well-being. Taking a holiday or a gap in trading is not just a luxury; it’s a necessity. Here’s why: Mental Recharge: Our brains are not designed to function at full capacity 24/7. They need time to rest and recharge. Continuous trading without breaks can lead to cognitive fatigue, reducing our ability to think clearly and make sound decisions. A holiday allows the brain to relax, recover, and come back refreshed. Stress Reduction: The constant ups and downs of trading can elevate stress levels. Chronic stress is linked to a host of health problems, including heart disease, high blood pressure, and mental health disorders like depression and anxiety. Taking time off helps lower stress levels and provides a mental reset. Perspective and Reflection: Stepping away from the trading desk allows traders to gain perspective. It’s a chance to reflect on their strategies, learn from their experiences, and make improvements. This reflection can lead to better decision-making and more effective trading strategies in the long run. Everyday Examples Consider the example of athletes. They follow rigorous training schedules but also include rest days in their routines. These rest days are crucial for muscle recovery and overall performance enhancement. Without rest, athletes are more prone to injuries and burnout. Similarly, traders need their “rest days” to perform optimally. Another everyday example is students preparing for exams. Continuous studying without breaks can lead to burnout and reduced performance. However, students who take regular breaks, get enough sleep, and relax tend to perform better academically. The same principle applies to trading. The Consequences of Not Taking Breaks Failing to take breaks can have serious consequences. Prolonged periods of stress without respite can lead to depression. Depression is more than just feeling sad; it can severely impact one’s ability to function, affecting decision-making, focus, and overall quality of life. In the context of trading, this can mean poor trading decisions, significant financial losses, and a downward spiral of stress and mental health issues. Conclusion In conclusion, taking a holiday or a gap in trading is vital for maintaining mental health and overall well-being. Continuous trading without breaks can lead to cognitive fatigue, increased stress levels, and serious mental health issues like depression. By taking regular breaks, traders can recharge their minds, reduce stress, gain perspective, and ultimately make better trading decisions. Just as a car needs regular maintenance to keep running smoothly, our minds need regular breaks to function at their best. So, if you’re a trader, remember to step off the treadmill now and then—your mind and health will thank you.
Navigating the Financial Seas: A Guide to Day Trading, Scalping, and Beyond
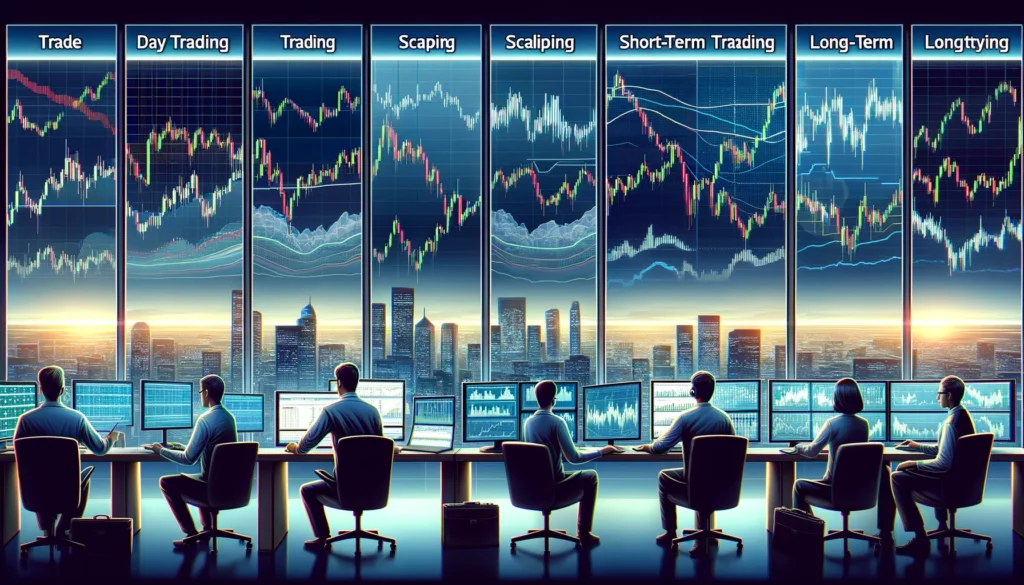
Imagine you’re at a busy farmer’s market. Each vendor and customer is trying to make the best deal possible, whether they’re there for a quick buy or a long-term investment. The world of trading is quite similar, with various strategies tailored to different time frames and market conditions. Understanding these strategies—day trading, scalping, swing trading, short-term trading, mid-term trading, and long-term investing—can help traders make informed decisions based on their goals and market dynamics. Day Trading: Riding the Daily Waves Think of day trading like running a food truck at the market. Each day, you buy fresh ingredients, cook your meals, and sell everything before the day ends. You aim to make a profit within those few hours, and at the end of the day, you close up shop with no leftovers. Day traders buy and sell stocks or other financial instruments within the same trading day. They rely on quick decisions and a constant watch on the market, aiming to capitalize on short-term price movements. It’s fast-paced and can be rewarding, but it also comes with high risks. Scalping: Quick Dips in the Market Scalping is like being a vendor selling small, popular items, such as snacks or drinks, at the market. You make lots of small sales throughout the day, each one contributing to your overall profit. Scalpers make numerous trades in a single day, holding their positions for just a few seconds or minutes to capture tiny price changes. This strategy requires sharp attention and rapid execution, as even minor market shifts can impact profits. Swing Trading: Catching the Market Swings Swing trading is similar to a farmer who plants crops and waits a few weeks to a few months before harvesting. The farmer isn’t concerned with daily weather changes but focuses on the overall growing season. Swing traders hold their positions for several days to weeks, aiming to profit from market trends and patterns. They use a mix of technical and fundamental analysis to identify opportunities and are generally more patient than day traders, waiting for the right moment to buy or sell. Short-Term Trading: Adapting to Market Conditions Short-term trading is like buying seasonal products at the market. For instance, you might buy pumpkins in October or holiday decorations in December, knowing these items will sell well within a few months. Short-term trading typically spans from three to six months. Traders in this category might extend their holding periods when the market is expected to move sideways or temporarily decline. They adapt their strategies based on current market conditions, using both technical and fundamental analysis to guide their decisions. Mid-Term Trading: Balancing Risk and Reward Mid-term trading is akin to investing in a small business at the market, like a new bakery. You’re looking at a time frame of six months to a year, balancing the potential risks and rewards. Mid-term traders aim to benefit from significant market movements without the constant pressure of daily monitoring. They consider broader economic trends, company performance, and industry developments to make their investment decisions. Long-Term Investing: The Patient Path Long-term investing is like owning a stall that sells aged cheese. You buy the cheese, let it mature over several years, and sell it when it reaches its peak quality. Long-term investors hold assets for several years, focusing on the intrinsic value of their investments. They consider factors like company management, competitive advantage, and market potential, with the patience to ride out short-term market volatility for long-term gains. Adjusting Strategies for Market Conditions When the market enters a sideways movement or faces temporary downturns, traders might adjust their strategies. For instance, a fruit vendor might choose to sell preserved jams instead of fresh fruits during the off-season. Similarly, short-term and mid-term traders might extend their holding periods to allow for market recovery, reducing the impact of short-term volatility. Conclusion: Charting Your Course Whether you’re operating a food truck, selling seasonal products, or aging cheese for years, each trading strategy offers unique opportunities and challenges. By understanding these approaches and adapting to market conditions, you can make informed decisions and navigate the financial markets successfully. Choose the strategy that best fits your goals and risk tolerance, and you’ll be well on your way to financial success.
Charting Your Course: The Power of Self SWOT Analysis in Trading

Imagine you’re planning a long road trip across the country. Before hitting the road, you’d probably want to check your car’s engine, fill up the gas tank, and map out your route. This preparation ensures that you’re ready for the journey ahead and can handle any surprises along the way. Entering the world of trading without a self SWOT analysis is like embarking on that road trip with no map, no gas, and an unchecked engine. A self SWOT analysis—assessing your strengths, weaknesses, opportunities, and threats—can be the crucial preparation that sets you up for success in the trading market. What is a Self SWOT Analysis? A SWOT analysis is a strategic planning tool used to identify and evaluate the internal and external factors that can impact your goals. Here’s how it breaks down: Strengths: What are you good at? What resources do you have at your disposal? Weaknesses: What areas need improvement? What skills or knowledge are you lacking? Opportunities: What external factors can you capitalize on to achieve success? Threats: What external challenges could hinder your progress? By understanding these elements about yourself, you can create a tailored strategy that leverages your strengths, addresses your weaknesses, takes advantage of opportunities, and mitigates threats. Strengths: Building on Your Foundation Consider Emma, a detail-oriented financial analyst with a knack for spotting market trends. Her analytical skills and attention to detail are her strengths. When Emma decided to start trading, she capitalized on these strengths by focusing on data-driven strategies and meticulous research. This approach helped her make informed decisions and build a profitable trading portfolio. To identify your strengths, ask yourself: What skills do I excel at? What unique knowledge or experience do I bring to the table? How can I use my strengths to gain an edge in trading? Weaknesses: Acknowledging and Improving Now, let’s take John, who was excited about trading but struggled with emotional decision-making. His impulsive nature often led to hasty trades and significant losses. By acknowledging this weakness, John took steps to improve his emotional discipline. He started using automated trading systems and set strict trading rules to minimize the impact of his emotions on his decisions. To pinpoint your weaknesses, consider: What skills do I need to improve? How do my weaknesses affect my trading decisions? What steps can I take to address these weaknesses? Opportunities: Seizing the Moment Sarah, an early adopter of new technologies, saw the rise of cryptocurrency as a golden opportunity. Her tech-savviness and curiosity about blockchain allowed her to enter the market early and reap substantial rewards. By staying informed about emerging trends and continuously learning, Sarah leveraged her knowledge to capitalize on this new trading frontier. To identify your opportunities, reflect on: What market trends can I take advantage of? How can I stay informed about emerging opportunities? What resources or networks can help me seize these opportunities? Threats: Navigating Challenges Lastly, consider Michael, who entered the trading market without a full understanding of regulatory changes that could impact his investments. He faced unexpected losses when new regulations were introduced. By recognizing this oversight, Michael started keeping a closer eye on legal and market developments, which helped him navigate future challenges more effectively. To recognize your threats, ask yourself: What external factors could negatively impact my trading? How can I stay updated on potential threats? What contingency plans can I develop to mitigate these risks? Conclusion: The Roadmap to Success A self SWOT analysis is your roadmap to success in trading. It equips you with the knowledge of your strengths to leverage, weaknesses to improve, opportunities to seize, and threats to prepare for. As Warren Buffett famously said, “Risk comes from not knowing what you’re doing.” By thoroughly understanding yourself and the market, you can minimize risks and maximize your chances of success. So, before you embark on your trading journey, take the time to conduct a self SWOT analysis. It’s the equivalent of ensuring your car is road-trip ready. With a clear understanding of your strengths, weaknesses, opportunities, and threats, you’ll be well-prepared to navigate the trading landscape and reach your financial destinations. Remember, successful trading is not just about making the right trades but also about being the right trader. By knowing yourself, you can tailor your strategies to align with your unique strengths and weaknesses, turning potential pitfalls into stepping stones towards success. Happy trading!
Cryptocurrency: Investment or Trading?

Introduction to Cryptocurrency Choice Many newcomers to the cryptocurrency world dive in without fully understanding whether they should be trading or investing. Often, they mimic the actions of others, making spontaneous decisions that might not suit their long-term financial goals. To make educated choices, it’s crucial to know the differences between trading and investing in cryptocurrency. Understanding Trading vs. Investing Investing: This approach is similar to buying a house with the intention to hold onto it for years, expecting its value to increase over time. In cryptocurrency, long-term investing involves deep knowledge of the project’s fundamentals, such as its technology, market potential, and team. An investor might buy Bitcoin or Ethereum and hold it for years, regardless of the price fluctuations, aiming for substantial gains as the market matures. Trading: On the other hand, trading is like buying and selling stocks within a short period—days, hours, or even minutes. It primarily utilizes technical analysis, which involves reading charts and using statistical indicators to predict short-term price movements. Traders might buy a coin because the charts suggest a quick uptick in price, and sell it as soon as they achieve a small profit, or to cut a loss. Real-World Examples Investor Scenario: Imagine Sarah, who buys $5,000 worth of a promising new coin, planning to hold it for five years. She’s not worried when the price dips 20% in the first few months; she’s focused on the potential growth from technological advancements and broader market adoption. Trader Scenario: Contrast this with Bob, who uses $1,000 to trade different cryptocurrencies weekly. He watches the market trends closely, buys when a short uptrend is predicted, and sells as soon as he hits a target profit or notices a downturn. Bob’s strategy requires staying very active and informed about market fluctuations. Strategy and Mindset For Investors: Patience is key. An investor needs a high tolerance for volatility and must believe in the long-term prospects of their holdings. Fundamental analysis is crucial here, involving a thorough understanding of what makes a cryptocurrency project viable in the long haul. For Traders: Agility and prompt decision-making are vital. Traders benefit from understanding market patterns and must be ready to react quickly to take profits or prevent losses. This approach is less about the project’s fundamentals and more about timing the market. Risks and Rewards Investors may see higher overall returns if their chosen cryptocurrencies succeed, but this comes with the risk of holding through potentially significant dips in value. Traders might generate returns more quickly and have opportunities to profit from both rising and falling markets, but they face the risk of frequent, smaller losses and the high stress of constant market monitoring. Conclusion: Making the Right Choice Whether you should trade or invest depends on your financial goals, time commitment, and risk tolerance. If you are looking to grow wealth over time and can handle the ups and downs, investing might be right for you. However, if you seek quicker returns and enjoy the thrill of the market’s volatility, trading could be a better fit. Before starting, take time to educate yourself. Joining courses, participating in forums, and practicing with small amounts can help you understand your preferences and capabilities in the crypto market. Remember, whether you choose to trade or invest, the goal is to make informed decisions that align with your overall financial strategies.
