
DOT coin and Polkadot explained with price analysis
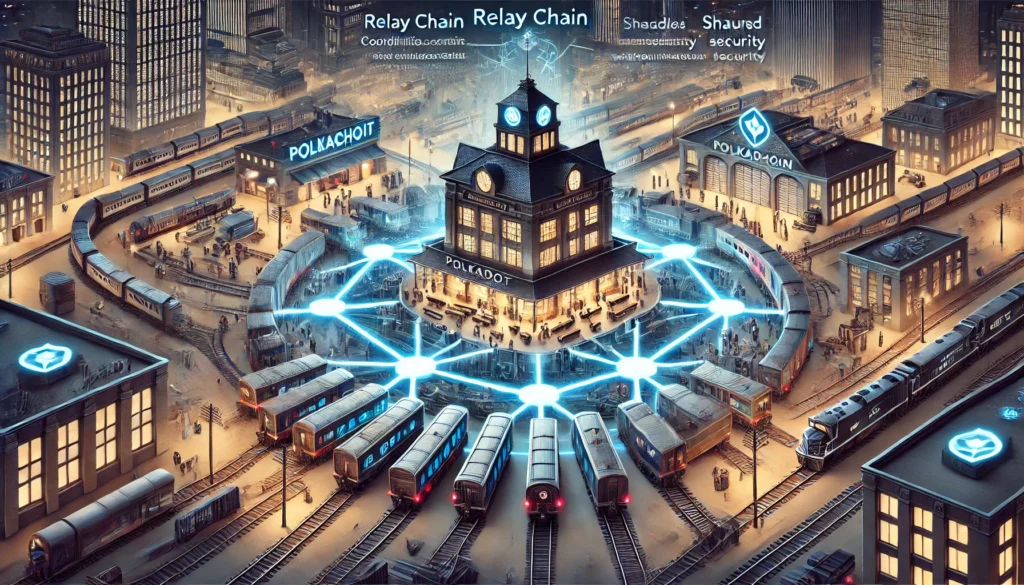
Imagine you’re setting up a new office, but instead of desks and chairs, you’re dealing with digital data and blockchain networks. This is where Polkadot and its native cryptocurrency, DOT, come into play. Polkadot is like the architectural blueprint for a sprawling digital metropolis, enabling different blockchain “buildings” to communicate and share resources efficiently. The Polkadot Network: A Digital Metropolis Polkadot, developed by the Web3 Foundation, is a blockchain platform designed to allow different blockchains to interoperate seamlessly. Think of it as a digital metropolis where various specialized districts (blockchains) are connected by a central hub (the Relay Chain). This design enables each district to maintain its unique features while benefiting from shared security and interoperability. Key Features of Polkadot 1. Relay Chain: The Central Hub The Relay Chain is the heart of the Polkadot network, akin to a central train station in a bustling city. This station coordinates the arrivals and departures of various trains (blockchains), ensuring they can operate simultaneously and share resources without chaos. The Relay Chain provides shared security for all connected blockchains, meaning each one doesn’t need to secure itself independently. It also facilitates communication between different blockchains, much like a station managing train schedules and passenger transfers. To further illustrate, consider how a central station ensures that all trains follow a schedule, share tracks without collisions, and benefit from centralized security and maintenance. The Relay Chain plays a similar role in Polkadot, managing data transfer, validating transactions, and securing the network. 2. Parachains: The Specialized Trains Parachains are like individual trains connected to the Relay Chain. Each train represents a blockchain with its own specific functions and data, tailored to serve different purposes. These parachains allow for parallel processing of transactions, increasing the overall network’s efficiency and scalability. Each parachain is optimized for specific tasks, such as finance, supply chain management, or gaming, and operates independently while relying on the Relay Chain for security and interoperability. Imagine specialized cargo trains, each designed to transport specific goods like coal, electronics, or food. These trains can operate simultaneously without interference, making the overall system more efficient. Parachains work similarly, each handling specific types of transactions or applications, which boosts Polkadot’s capacity and performance. 3. Interoperability: Polkadot facilitates the transfer of any type of data or asset across blockchains, making it a true multi-chain environment. This interoperability is achieved through its unique cross-consensus messaging format (XCM), which acts as a universal translator between different blockchains. For example, if one blockchain is like a Spanish-speaking district and another like an English-speaking district, XCM would be the interpreter that allows them to communicate seamlessly, enabling smooth transactions and data sharing. 4. Security: One of Polkadot’s standout features is pooled security. Instead of each blockchain having to secure itself independently, they all benefit from the shared security provided by the Relay Chain. This makes it easier for new blockchains to launch with robust security from day one. Think of it as a neighborhood watch program where every household contributes to and benefits from collective security. This shared approach enhances the safety of the entire community, making it more difficult for malicious activities to succeed. 5. Governance: Polkadot has a sophisticated on-chain governance system. DOT token holders have a say in protocol upgrades and decisions, making the network highly democratic. This governance model ensures that changes can be made transparently and without hard forks. Imagine a city council where every resident can vote on important issues, propose changes, and help shape the future of their community. Polkadot’s governance system empowers token holders in a similar way, ensuring the network evolves according to the community’s needs and preferences. 6. Staking: To keep the network secure, Polkadot uses a nominated proof-of-stake (NPoS) mechanism. In this system, DOT holders can either run a validator node or nominate others to do so, earning rewards for good behavior while being penalized for bad actions. This ensures the network remains decentralized and secure. Staking is like having citizens volunteer as security guards, with rewards for good service and penalties for negligence. This system maintains order and encourages active participation in keeping the network safe. The DOT Coin: The Lifeblood of Polkadot DOT is the native coin of the Polkadot network, serving several critical functions: 1. Governance: DOT holders participate in the decision-making process regarding network upgrades and changes, making the platform truly community-driven. 2. Staking: DOT coins are used to stake on the network, which helps secure it and process transactions. Stakers are rewarded for their contributions, which encourages active participation in maintaining the network’s health. 3. Bonding: New parachains are added to the network through a process called bonding, which involves locking up DOT tokens. This process ensures that only committed and valuable projects get to join the Polkadot ecosystem. DOT Coin Technical Analysis The all-time high (ATH) for DOT coin is $55, while the all-time low (ATL) is $2.7. DOT reached this ATL in 2020. Subsequently, it soared to its ATH of $55 in 2021. During the 2022 bear market, DOT mostly traded within the $4 to $8 range above its ATL. As of now, the price of DOT is approximately $5.7, which remains within this lower range. On the weekly timeframe, the current point of control is slightly above the present price, still within this range. DOT’s current market cap is $8 billion, a significant drop from a few months ago when it was $14 billion. At its peak in 2021, the market cap reached $55 billion. Despite the market fluctuations, DOT is considered a robust blockchain project with strong services. Based on its performance and potential, it is expected that DOT could perform as well as, if not better than, its previous highs during the next bull run. Key Price Levels: If the price goes up: $7.489 $9.491 $14 $17 $23 $27 $32 $34 $38 $41 $45 If the price goes down: $5 $3 Disclaimer: This is not financial advice (NFA). Always do your own research before making any investment decisions. Why
The Ripple Effect: How News Impacts the Crypto Market

The Impact of News on the Cryptocurrency Market Imagine the cryptocurrency market as a vast ocean, with investors as surfers riding the unpredictable waves. News, in this analogy, acts as the wind—sometimes a gentle breeze, sometimes a violent storm—shaping the size and intensity of the waves. In the cryptocurrency world, where prices can soar or plummet within minutes, understanding how news influences the market is crucial for anyone looking to navigate these turbulent waters. This essay explores the profound impact of news on the crypto market, delving into five significant news events and their repercussions on prices. We will also unpack the phenomenon of “sell the news,” a strategy where large investors, or “whales,” capitalize on market hype. The Double-Edged Sword of News News can be both a boon and a bane for the crypto market. Positive news (like interest rate cut) can drive investor confidence, leading to price surges, while negative news can trigger panic selling and steep declines. The rapid dissemination of information in today’s digital age means that the crypto market is highly sensitive to news events, with prices reacting almost instantaneously. Case Study 1: Tesla’s Bitcoin Investment On 08 February 2021, Tesla announced it had purchased $1.5 billion worth of Bitcoin and planned to accept it as payment for its electric cars. This news was a significant endorsement of Bitcoin’s legitimacy and potential as a mainstream financial asset. Following the announcement, Bitcoin’s price soared from around $38,000 to a peak of nearly $46,700 in a day. This was surge of $8,000 dollar within a day. In next few days it soared to $58,000. Impact on Prices: Before Announcement: ~$38,000 After Announcement: ~$58,000 The news led to a massive influx of retail and institutional investors, driving up demand and prices. However, this surge was also accompanied by increased volatility as traders speculated on future price movements. Case Study 2: China’s Crackdown on Cryptocurrencies In May 2021, China announced a sweeping crackdown on cryptocurrency mining and trading. The news sent shockwaves through the market, leading to a significant sell-off. Bitcoin’s price, which had been hovering around $55,000, plummeted to below $30,000 within weeks. Impact on Prices: Before Announcement: ~$55,000 After Announcement: ~$30,000 China’s announcement underscored the impact that regulatory news can have on the crypto market. The fear of further crackdowns led to a mass exodus of miners from China and significant price volatility. Here, we must note that according to some analysts China never completely banned cryptocurrencies in its main land and that’s why the Chinese trading on Binance is exceeding $90B. Case Study 3: El Salvador Adopts Bitcoin as Legal Tender On June 09, 2021, El Salvador became the first country to adopt Bitcoin as legal tender. This historic decision was hailed as a milestone for Bitcoin’s adoption. The news initially caused Bitcoin’s price to surge from around $33,500 to over $41,000. However, implementation challenges and skepticism from international financial institutions led to a price drop shortly after. Impact on Prices: Before Announcement: ~$33,500 After Initial Surge: ~$41,000 After Implementation Challenges: ~$28,000 This case highlights how positive news can boost prices, but also how subsequent developments and uncertainties can temper initial enthusiasm. Let us tell you something. When El Salvador first bought 200 Bitcoin in September 2021, the IMF’s reaction was harsh, causing the price to drop quickly within an hour. At around $43,000, President Nayib Bukele announced that they had purchased an additional 200 Bitcoin at discounted prices. This move stopped the rapid decline in price. It appears that there was some questionable financial maneuvering against the country for making Bitcoin legal tender instead of the dollar. Case Study 4: SEC’s Approval of Bitcoin Futures ETF In October 2021, the U.S. Securities and Exchange Commission (SEC) approved the first Bitcoin futures ETF (Exchange-Traded Fund). This news was seen as a major step towards mainstream acceptance of Bitcoin and other cryptocurrencies. Bitcoin’s price jumped from around $57,000 to a high of $69,000 (that time’s ATH) following the announcement. Impact on Prices: Before Announcement: ~$57,000 After Announcement: ~$69,000 The approval of the ETF attracted a wave of new investors, reflecting the growing integration of cryptocurrencies into traditional financial markets. Case Study 5: FTX Collapse and Market Crash In November 2022, the collapse of FTX, one of the largest cryptocurrency exchanges, triggered a market-wide crash. The news led to widespread panic and a sharp decline in prices. Bitcoin’s price fell from around $21,000 to below $16,000, with other cryptocurrencies experiencing similar declines. Impact on Prices: Before Collapse: ~$21,000 After Collapse: ~$16,000 The FTX collapse underscored the vulnerabilities in the crypto market and the importance of robust infrastructure and regulatory oversight. The “Sell the News” Phenomenon The concept of “sell the news” is a strategy where large investors, often referred to as “whales,” capitalize on market hype generated by positive news. Whales are investors with substantial holdings, capable of influencing market prices through their trading activities. Here’s how “sell the news” typically plays out: Positive News Announcement: A piece of positive news, such as a major company investing in Bitcoin or a favorable regulatory decision, generates excitement and optimism in the market. Price Surge: Retail investors and smaller traders, motivated by the positive news, start buying, driving up the price. Whales Sell: As the price peaks due to the influx of buyers, whales begin to sell their holdings. Because whales hold large amounts of cryptocurrency, their selling can create significant downward pressure on prices. Market Correction: Once the whales have sold their holdings, the market often experiences a correction, with prices falling from their highs. This strategy leverages the psychological impact of news on retail investors, who often act on emotion and herd behavior. By selling into the hype, whales can secure profits before the market corrects itself. Example of “Sell the News” A notable example of “sell the news” occurred in the aftermath of the Tesla Bitcoin announcement. While the initial news drove prices up significantly, subsequent sales by large investors led to a correction. The price
Profits with Order Blocks: A Guide to Strategic Trading

Imagine you’re at a bustling farmers’ market on a Saturday morning. Each vendor has a unique spot where they sell their goods, and regular customers know exactly where to go to get the best deals. In the world of trading, an “order block” is a bit like these regular vendor spots—it’s a place on a price chart where significant buying or selling activity has taken place. Understanding order blocks can help traders predict where prices might move next, just like knowing which vendors offer the best deals can make your market trip more efficient. What is an Order Block? In simple terms, an order block is a zone on a trading chart where big institutions, like banks or hedge funds, have placed large buy or sell orders. These blocks indicate areas of strong support or resistance. Think of it as a footprint left behind by big players in the market. When these institutions buy or sell in large quantities, they leave a mark on the price chart, which traders can use to their advantage. Order blocks are shown on charts as points with multiple bounce backs (as shown in image below). They are not just random occurrences; they represent a concerted effort by major players to buy or sell at specific price levels. This activity often creates a kind of “memory” in the market. Traders can look at these historical levels to gauge future price movements. In this chart, you can see two boxes: green and red. The green box represents a range from which the price usually bounces. This acts similarly to a support level but covers a wider range. When the price reached this range in the past, buying orders countered the selling pressure, causing the price to rise from this point. It is likely that the same situation will occur when the price reaches this range again, as traders who have observed this level will place buy orders here. The same principle applies to the red box, which indicates a selling point. When the price reached this level previously, numerous selling orders forced it to go back down. It is likely that this scenario will repeat next time. Note that each support, resistance, trend, and order block eventually breaks. If this were not the case, the market would always move sideways and fade away due to squeezing movements. For example, if someone bought at $60,000 and sold at $71,000, they might try to buy at $61,000 the next time to avoid missing out if the price doesn’t drop to $60,000 again, and they might aim to sell at $70,000 to avoid rejection. This behavior squeezes the price, eventually causing it to stop moving. Thus, every block breaks in the end, marking the beginning of a new trend. Why Do Order Blocks Matter? Order blocks matter because they can signal potential price reversals or continuations. For instance, if a large institution buys a significant amount of a stock at a certain price level, that level becomes a strong support area. If the price drops to that level again, other traders might expect it to bounce back up, creating a buying opportunity. Conversely, if a large institution sells a lot at a certain price, that level becomes a resistance area. If the price climbs back to that level, traders might expect it to fall again, creating a selling opportunity. Order blocks provide a sort of roadmap for traders. By recognizing where large orders have previously been placed, traders can anticipate where future support and resistance levels might be. This understanding can lead to more strategic trading decisions and better risk management. Spotting Order Blocks on a Chart Let’s break down how you can spot order blocks on a chart: Identify Strong Price Movements: Look for areas on the chart where the price has moved sharply up or down. These strong moves often indicate the presence of large orders from institutions (see image above). Look for Consolidation Areas: Before a strong move, prices often consolidate or move sideways. This consolidation phase is where institutions might be placing their orders quietly but this is not the case always. Check Volume: High trading volume during these periods of consolidation can be a clue that big players are involved. When volume spikes, it often indicates that significant buying or selling is taking place. This is not necessary for each bounce. Observe Price Reactions: Notice how prices react when they revisit these areas. If prices tend to bounce back up from a specific level repeatedly, it suggests a buy order block. If they fall from a level repeatedly, it indicates a sell order block. Real-World Example: The Farmers’ Market Analogy Imagine you’re at the farmers’ market, and there’s a particular stall that always has fresh apples. One day, you notice that the vendor has put up a big sign saying “Fresh Apples, Limited Stock!” and there’s a rush of customers buying apples. The next week, you come back and see that the vendor has put up the same sign again, and once more, people are rushing to buy. In trading terms, that vendor’s spot is an order block. The vendor (like a big institution) creates significant buying activity at that spot, and the customers (like traders) recognize this and follow suit. They know that when the vendor signals fresh apples, it’s time to buy. Similarly, if another vendor has a surplus of oranges and slashes prices to sell quickly, you’ll notice a surge in buying activity. Next time you see those low prices, you might anticipate another rush. This mirrors how sell order blocks function in trading. How to Use Order Blocks in Trading Now that you understand what order blocks are, here’s how you can use them in your trading strategy: Set Entry and Exit Points: Use order blocks to set your entry and exit points. If you identify a buy order block, you might set a buy order just above this level. Conversely, if you identify a sell order block, you
Bitcoin All Time High (ATH): Navigating the Cycles of Crypto Markets
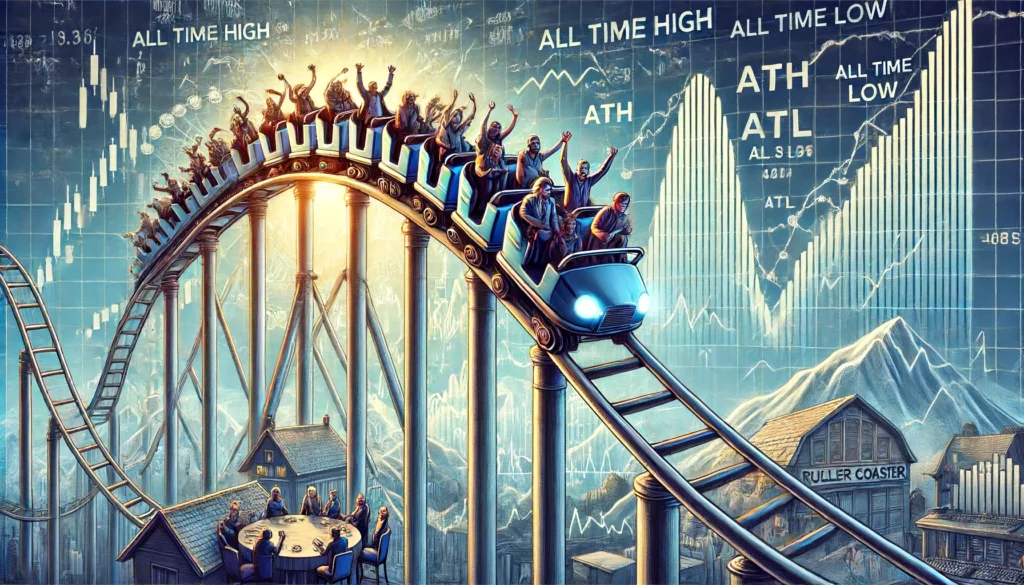
Riding the Financial Roller Coaster: Understanding Market Cycles Did you ever wonder why Bitcoin makes all time high (ATH) and all time low (ATL)? Why it does not go straight to upside? Imagine standing in line for a roller coaster. As you watch, the cars climb steep hills, crest at dizzying heights, and then plummet into deep valleys. Your anticipation builds with each scream of excitement and terror from the riders. Now, consider the financial markets as that roller coaster, constantly cycling through thrilling peaks and terrifying drops. Understanding these market cycles can make the ride less daunting and more profitable, helping you make informed investment decisions. The Fundamentals of Financial Market Cycles Financial markets, including stocks, bonds, and cryptocurrencies, operate in cycles. These cycles consist of periods of expansion and growth (bull markets) followed by periods of contraction and decline (bear markets). The movement of these cycles is influenced by various factors, such as economic conditions, global events, wars, and changes in interest rates. For instance, let’s look at the period between 2022 and 2023, when the interest rate in the United States climbed to 5.5%. This increase had a substantial negative impact on all financial markets. The reason is simple: higher interest rates make saving money in the bank more attractive because of the increased returns, leading investors to pull money out of riskier investments like stocks and cryptocurrencies. Moreover, higher borrowing costs due to increased interest rates can stifle companies’ growth and investment plans, adversely affecting their balance sheets and stock prices. The Impact of Interest Rates on Financial Markets To understand the impact of interest rates, imagine you’re running a business. When interest rates are low, you can borrow money at a lower cost to expand your operations, hire more staff, and invest in new technology. These activities typically lead to higher profits and, consequently, a rising stock price. However, when interest rates rise, borrowing becomes more expensive. You might have to cut back on expansion plans and investments, which can result in lower profits and a declining stock price. This relationship is why investors closely monitor interest rate changes. A hike in interest rates generally signals a more challenging environment for businesses, leading to a decline in stock prices and the onset of a bear market. Conversely, when interest rates fall, it can stimulate economic activity and lead to a bull market. The Cyclical Nature of Bitcoin and Cryptocurrencies Bitcoin, the pioneering cryptocurrency, also follows cyclical patterns, albeit over a shorter history compared to traditional financial markets. Bitcoin’s cycle typically spans four years and includes a year of rapid growth (bull run), a year of decline (bear market), and two years of recovery and stabilization. A crucial event in Bitcoin’s cycle is “halving,” which occurs approximately every four years. During a halving event, the reward for mining new Bitcoin blocks is halved, effectively reducing the supply of new Bitcoins. This scarcity often triggers a bull run, but significant price increases usually start a few months after the halving. However, other factors can also influence Bitcoin’s price. For example, in 2022, when Russia invaded Ukraine, Bitcoin, like other risky assets, experienced a sharp decline. This drop coincided with a bear market year for Bitcoin, highlighting how various factors can simultaneously impact market cycles. Real-World Examples: The Cyclical Nature of Bitcoin and Cryptocurrencies The 2013 Cycle and first all time high (ATH) In 2013, Bitcoin went through one of its first significant bull runs. At the beginning of the year, Bitcoin was trading at around $13. By April, it had surged to over $260, marking a substantial increase. This growth was driven by increasing media coverage and growing interest in cryptocurrencies. However, this rapid rise was followed by a sharp decline, with Bitcoin prices falling back to around $50 by mid-year. The market then entered a second bull phase, and by the end of 2013, Bitcoin reached a new all-time high of around $1,150 before entering a bear market. The 2017 Cycle The 2017 Bitcoin cycle is one of the most well-known in the cryptoverse. Bitcoin started the year at approximately $1,000 and experienced an explosive bull run, reaching an all-time high of nearly $20,000 in December. This surge was fueled by increased adoption, the launch of Bitcoin futures markets, and a frenzy of retail investor interest. However, this peak was short-lived, and Bitcoin entered a prolonged bear market in 2018, with prices dropping to around $3,200 by December 2018. The subsequent recovery phase saw Bitcoin stabilizing and slowly regaining value over the next two years. The 2020-2021 Cycle Bitcoin’s most recent cycle began in 2020. The COVID-19 pandemic initially caused a sharp decline in Bitcoin’s price, with a drop to around $4,000 in March 2020. However, as governments around the world implemented stimulus measures and interest rates were slashed, investors sought out alternative assets, leading to a significant bull run. By December 2020, Bitcoin had surpassed its previous all-time high, and by April 2021, it reached a new peak of around $64,000. This bull run was driven by several factors: increased institutional adoption (with companies like Tesla and MicroStrategy investing heavily in Bitcoin), growing acceptance as a store of value, and widespread media coverage. However, by mid-2021, Bitcoin experienced a sharp correction, dropping to around $30,000. Factors contributing to this decline included regulatory concerns in China, which cracked down on cryptocurrency mining and trading, and environmental concerns about Bitcoin’s energy usage. After this correction the second bull began and price surged to $69,000 before bear market started. The Influence of External Events As mentioned earlier, Bitcoin’s price is not only influenced by internal factors like halving but also by external events. The 2022 Russian invasion of Ukraine is a prime example. When the conflict began, global financial markets, including cryptocurrencies, experienced significant volatility. Investors typically react to such geopolitical tensions by moving away from riskier assets, and Bitcoin was no exception. This led to a sharp decline in Bitcoin’s price, further exacerbating the bear market
The Merger of AI Giants: An Exploration of FET, OCEAN and AGIX merger to ASI

AI or Artificial Intelligence has rapidly evolved from a concept in science fiction to a transformative force across various industries. It refers to the capability of machines to mimic human intelligence, performing tasks like learning, problem-solving, and decision-making. AI’s applications range from virtual assistants like Siri and Alexa to complex systems managing logistics, finance, and healthcare. The Evolution of AI The journey of AI began in the mid-20th century with pioneers like Alan Turing, who questioned whether machines could think. Early AI research focused on symbolic reasoning and problem-solving. The 1980s saw the rise of machine learning, where computers learned from data rather than being explicitly programmed. The advent of deep learning in the 2010s, fueled by big data and powerful computing, has led to significant breakthroughs, making AI more efficient and accessible. Major AI Projects and Their Services Several notable AI projects have made significant impacts: IBM Watson: Known for winning “Jeopardy!”, Watson has applications in healthcare for diagnosing diseases and in customer service for automating responses. Google DeepMind: Famous for developing AlphaGo, which defeated the world champion Go player, DeepMind focuses on reinforcement learning and has applications in energy efficiency and healthcare. OpenAI: Creator of GPT-3, OpenAI’s models are used in language processing, from chatbots to creative writing assistance. AI in Crypto and Web 3 The integration of AI with blockchain technology, often referred to as AI in crypto or Web 3, represents a fusion of intelligent decision-making with decentralized networks. This combination enhances transparency, security, and efficiency. In Web 3, AI can automate and optimize decentralized finance (DeFi) protocols, enhance smart contracts, and manage supply chains more effectively. The Future of AI in Crypto AI’s role in crypto is set to expand as it can bring advanced analytics and automation to blockchain networks. By integrating AI, blockchain platforms can offer more robust solutions for fraud detection, predictive analytics, and autonomous decision-making. This synergy promises to drive innovations in various sectors, from finance to logistics. Overview of FET, OCEAN, AGIX, and ASI Tokens Fetch.ai (FET) Fetch.ai combines blockchain with AI to create a decentralized digital economy. It uses autonomous agents that perform tasks such as data sharing, process optimization, and transaction execution without human intervention. These agents are particularly useful in logistics, smart cities, and energy management. Imagine a city where traffic lights can adjust in real-time based on current traffic conditions, emergency vehicles get automatic green lights to save lives, and electric cars find the nearest charging station. Fetch.ai’s agents could manage all these tasks autonomously, ensuring efficiency and reducing human error. Ocean Protocol (OCEAN) Ocean Protocol aims to unlock data for AI consumption by creating a decentralized data exchange. It allows data providers to monetize their data while ensuring privacy and control. The Ocean token is used for buying and selling data, incentivizing data sharing, and participating in governance. For instance, a healthcare provider could share anonymized patient data on the Ocean Protocol, allowing AI researchers to develop better diagnostic tools while keeping patient information secure and private. This way, vital medical advancements can be made without compromising confidentiality. SingularityNET (AGIX) SingularityNET is a decentralized marketplace for AI services. It enables developers to publish, share, and monetize their AI algorithms, while users can purchase these services using AGIX tokens. This platform fosters collaboration among AI researchers and developers, democratizing access to AI technologies. Imagine a small business wanting to use AI to analyse customer feedback. They can purchase a sentiment analysis service from SingularityNET without needing to develop the AI themselves, making advanced technology accessible to everyone. Artificial Superintelligence (ASI) ASI token is part of the Superintelligence Alliance, a collaboration between Fetch.ai, SingularityNET, and Ocean Protocol. This alliance aims to consolidate their AI capabilities and create a universal AI token to streamline AI services and foster a cohesive AI ecosystem. Consider an AI-powered global supply chain where Fetch.ai’s agents optimize logistics, Ocean Protocol provides the necessary data, and SingularityNET offers specialized AI services for demand forecasting and inventory management. The ASI token would facilitate transactions and integration across this unified ecosystem. The Merger and Its Importance The merger between Fetch.ai, SingularityNET, and Ocean Protocol to create the Artificial Superintelligence Alliance is a significant step towards a unified AI-driven blockchain ecosystem. This merger aims to integrate their technologies and resources, creating a powerful platform for decentralized AI applications. The ASI token will serve as the universal currency within this ecosystem, facilitating seamless interactions and transactions between the integrated platforms. The Future of the ASI Project The future of the ASI project looks promising, with potential applications in numerous sectors such as finance, healthcare, and logistics. By leveraging the combined expertise of Fetch.ai, SingularityNET, and Ocean Protocol, the ASI project can drive innovation and efficiency in AI applications. The merged platform is expected to enhance data sharing, improve AI service accessibility, and streamline complex processes across various industries. Understanding Total Supply of Tokens According to CoinMarketCap: ASI (the new token) will have a total supply of about 2.63 billion tokens. FET has a total supply of 2.63 billion tokens. OCEAN has a total supply of 1.4 billion tokens. AGIX has a total supply of 2 billion tokens. When you add up the total supply of FET, OCEAN, and AGIX, you get approximately 6.03 billion tokens. The total supply of ASI will be 56% less than this combined total. While this figure is not officially confirmed, it is publicly available information. Implications of Decreasing Supply and Future Price With a lower supply of ASI compared to the combined supply of FET, OCEAN, and AGIX, and considering the combined services these tokens provide, there’s a potential for ASI to become very valuable. The ASI token might even be worth double the value of FET. This is because the team and Binance has announced that FET holders will receive ASI on a 1:1 ratio, meaning if you hold 1 FET, you get 1 ASI. This consolidation (bringing together different tokens into ASI) aims to create a strong and efficient token
4 Pillars of Crypto: Algorithms, Blockchain, Mining, and Staking
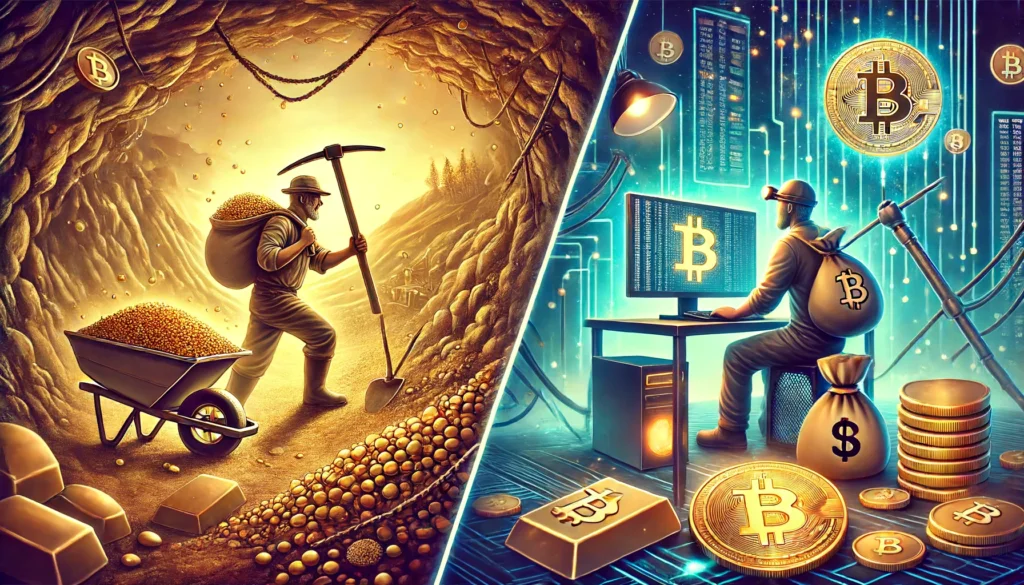
The Journey into Crypto Mining: Digging into Digital Gold Imagine you’re a treasure hunter, sifting through the earth, seeking gold. The excitement of finding those shiny nuggets is exhilarating, isn’t it? Now, let’s switch our scenery from dusty mines to the digital realm. Instead of a pickaxe and shovel, you have a computer and some specialized software. Welcome to the world of crypto mining – the modern-day equivalent of gold mining, but for digital treasures like Bitcoin. The Birth of Bitcoin and Crypto Mining Our story begins in 2009, when an anonymous person (or group) named Satoshi Nakamoto introduced Bitcoin, the first cryptocurrency. Bitcoin was revolutionary. It promised a new form of money, free from banks and government control. But how could new Bitcoins be created and verified? This is where mining comes into play. What is Crypto Mining? Crypto mining is like a gigantic online puzzle game. Imagine thousands of computers around the world racing to solve a complex mathematical problem. The first one to solve it gets to add a new block to the blockchain – a public ledger that records all Bitcoin transactions. As a reward, the solver receives a certain number of Bitcoins. This process is called “mining” because it mimics the extraction of precious metals from the earth. The Early Days of Crypto Mining In the beginning, crypto mining was relatively straightforward. Anyone with a decent computer could participate. Enthusiasts set up mining rigs in their garages and basements, hoping to strike digital gold. The competition was friendly and the rewards were significant. However, as more people joined the race, the puzzles (or algorithms) became increasingly difficult to solve. This was intentional, ensuring that new Bitcoins were released at a steady, controlled rate. To keep up with the escalating difficulty, miners began using more powerful hardware, eventually leading to the creation of specialized mining machines called ASICs (Application-Specific Integrated Circuits). Mining Algorithms: The Brains Behind the Operation At the heart of crypto mining are algorithms – the brains behind the puzzles. Different cryptocurrencies use different algorithms. Let’s explore a few: SHA-256 (Bitcoin): This is the algorithm used by Bitcoin. It’s highly secure but requires immense computational power. Think of it as the toughest puzzle in the game, requiring a supercomputer to solve. Scrypt (Litecoin): Litecoin, often dubbed the silver to Bitcoin’s gold, uses the Scrypt algorithm. It’s designed to be more memory-intensive, making it harder for ASICs to dominate and allowing more people to participate using regular computers. Ethash (Ethereum): Ethereum, another popular cryptocurrency, used Ethash. It’s designed to be ASIC-resistant, promoting decentralization by allowing more people to mine using standard graphics cards (GPUs). X11 (Dash): Dash uses the X11 algorithm, which involves multiple rounds of hashing to ensure high security. It’s a bit like solving multiple smaller puzzles to get to the main prize. The Great Bitcoin Cash Fork As Bitcoin’s popularity soared, so did the number of transactions. This led to congestion, with transactions taking longer to process and fees increasing. A debate erupted within the Bitcoin community on how to address these issues. One faction wanted to increase the block size (the amount of data each block can hold) to speed up transactions. Another group favored keeping the block size small to maintain decentralization. This disagreement culminated in 2017 with a hard fork, a split in the blockchain. The original Bitcoin continued with the smaller block size, while a new version, Bitcoin Cash, was created with a larger block size. Think of it as a river splitting into two streams, each following a different path but stemming from the same source. The Rise of Staking: A New Way to Earn While mining has been the cornerstone of many cryptocurrencies, it’s not the only way to earn digital coins. Enter staking, a newer, more energy-efficient method. Instead of solving complex puzzles, staking involves holding a certain amount of cryptocurrency in a wallet to support the network’s operations, like validating transactions. In return, stakers earn rewards. Why the Shift from Mining to Staking? Mining, especially with high-power hardware, consumes vast amounts of electricity. This has raised concerns about its environmental impact. Staking, on the other hand, requires significantly less energy. It’s like (though not exactly the same) to earning interest by keeping money in a savings account rather than working physically demanding jobs to earn your keep. Ethereum, for instance, has been transitioning from a mining-based system (Proof of Work) to a staking-based system (Proof of Stake) with its Ethereum 2.0 upgrade. This shift aims to make the network more sustainable and scalable. Challenges and Evolution in Crypto Mining Crypto mining isn’t without its challenges. Here are a few: Environmental Concerns: As mentioned, mining requires a lot of energy. It is claimed that Bitcoin mining alone consumes more electricity than some small countries. This has led to calls for greener practices or a shift to less energy-intensive methods like staking. Centralization Risks: Over time, mining has become dominated by large players with significant resources, leading to concerns about centralization. This goes against the very ethos of cryptocurrencies, which aim to be decentralized. Regulatory Scrutiny: Governments worldwide are grappling with how to regulate cryptocurrencies and mining. Some countries have embraced it, while others have imposed strict regulations or outright bans. Technological Arms Race: As mining becomes more competitive, there’s a constant race to develop more efficient hardware. This can make it difficult for smaller players to compete. The Future of Crypto Mining and Beyond The world of crypto mining is constantly evolving. New technologies and methods are being developed to address current challenges. For example, there are ongoing efforts to create more energy-efficient mining algorithms and hardware. Additionally, the rise of staking and other consensus mechanisms is providing alternative ways to secure and validate blockchain networks. Despite its challenges, crypto mining remains a critical component of the cryptocurrency ecosystem. It’s the process that ensures transactions are verified and new coins are created. As technology advances and the industry matures, we can expect continued innovation
Layer 2 Chains For Blockchain Scalability

The Magic of Layer 2 Chains: Making Blockchain Faster and Cheaper Imagine you live in a bustling city where traffic jams are the norm. Every day, you spend hours stuck on the road, inching forward at a snail’s pace. Frustrating, right? Now, imagine that instead of expanding the crowded streets, the city planners build a network of high-speed trains that run above the city. These trains can carry people quickly to their destinations without getting stuck in traffic. This is a lot like what Layer 2 chains do for blockchain networks. Let’s dive into this fascinating world and see how it all works. The Blockchain Traffic Jam First, let’s understand the problem. A blockchain is like a public ledger where every transaction is recorded. The most well-known blockchain is Bitcoin, but Ethereum is also a major player, enabling smart contracts and decentralized applications (dApps). Every transaction on these blockchains needs to be verified by many participants (miners or validators), which can take time and consume a lot of resources. Imagine you’re in a grocery store, but instead of having multiple checkout lines, there’s only one cashier. Whether you’re buying a pack of gum or a full cart of groceries, everyone has to wait in the same line. This causes long delays and can be very costly, especially if you’re in a hurry. Similarly, as more people use Ethereum, for example, the network gets congested, making transactions slower and more expensive. Enter Layer 2 Chains Layer 2 chains are like the high-speed trains in our city analogy. They run on top of the main blockchain (Layer 1) and handle many transactions off the main network, only interacting with it when necessary. This significantly reduces congestion and lowers costs. Think of Layer 1 as the main roads and highways, and Layer 2 as an efficient train system that helps people avoid traffic jams. There are several types of Layer 2 solutions, but today, we’ll focus on a specific type called zk-Rollups, with zkSync being a popular example. But before we get into zk-Rollups, let’s quickly explore the broader landscape of Layer 2 solutions. Different Types of Layer 2 Solutions Understanding zk-Rollups Let’s dive deeper into zk-Rollups, particularly zkSync, to see how they work and why they’re so exciting. Zero-Knowledge Proofs To understand zk-Rollups, we first need to grasp the concept of zero-knowledge proofs (zk-proofs). Imagine you have a secret and you want to prove to someone that you know this secret without revealing what it is. This might sound impossible, but zero-knowledge proofs make it possible. A zero-knowledge proof allows one party to prove to another that they know a value (the secret) without disclosing the value itself. It’s like proving you have the answer to a puzzle without showing the actual solution. This cryptographic magic is the foundation of zk-Rollups. How zk-Rollups Work zk-Rollups bundle hundreds or even thousands of transactions into a single batch. Instead of verifying each transaction individually on the Ethereum mainnet, they create a cryptographic proof that all the transactions in the batch are valid. This proof is then submitted to the Ethereum blockchain. Here’s a simplified step-by-step process of how zk-Rollups work: This process dramatically reduces the load on the Ethereum network, making transactions faster and cheaper. zkSync in Action zkSync is a specific implementation of zk-Rollups designed to be user-friendly and developer-friendly. It aims to bring Ethereum’s scalability and affordability to the masses without compromising on security. Here’s why zkSync is a game-changer: Imagine paying for a cup of coffee with Ethereum. Without zkSync, the transaction fee could be more than the coffee itself. With zkSync, the fee becomes negligible, making micro-transactions viable. The Broader Impact of Layer 2 Solutions Layer 2 solutions like zkSync are crucial for the future of blockchain technology. Here’s why: Scalability Scalability is a major hurdle for blockchain networks. Without it, blockchains can’t support mass adoption. Layer 2 solutions enhance scalability, making blockchains capable of handling millions of users and transactions without breaking a sweat. Lower Costs High transaction fees are a significant barrier to entry for many users. Layer 2 solutions lower these costs, making blockchain technology accessible to everyone, from individual users to large enterprises. Improved User Experience Slow and expensive transactions can be frustrating. By making transactions faster and cheaper, Layer 2 solutions improve the overall user experience, encouraging more people to use blockchain-based applications. Greater Innovation With the scalability and cost issues addressed, developers can focus on creating innovative applications that leverage blockchain technology. This could lead to breakthroughs in various industries, from finance to supply chain management, gaming, and beyond. Real-World Examples and Applications Let’s look at some real-world examples to see how Layer 2 solutions like zkSync are making a difference: Decentralized Finance (DeFi) DeFi platforms allow users to borrow, lend, and trade assets without intermediaries. However, high fees and slow transactions can hinder their usability. zkSync enables faster and cheaper transactions, making DeFi more accessible and efficient. NFT Marketplaces Non-fungible tokens (NFTs) represent ownership of unique digital items like art, music, and collectibles. High transaction fees on the Ethereum network have been a major pain point for NFT creators and buyers. Layer 2 solutions like Arbitrum reduce these fees, enabling more artists to participate in the NFT space. Gaming Blockchain-based games often require frequent micro-transactions, which can be prohibitively expensive on the Ethereum mainnet. By leveraging layer 2 solutions, game developers can provide a seamless and cost-effective experience for players. Micropayments Services that rely on micropayments, such as tipping content creators or paying for digital goods, benefit immensely from the low fees and high throughput of Layer 2 solutions. zkSync and strk like networks make it feasible to send tiny amounts of money without losing a significant portion to transaction fees. The Road Ahead The development of Layer 2 solutions is a rapidly evolving field. As technology advances, we can expect even more efficient and innovative ways to scale blockchain networks. Here are some future trends to watch: Interoperability Different Layer 2
Trading’s Vital Pause: A most forgotten thing

Do you know what a trader miss most in trading? The importance of trading break. Imagine a car running nonstop, day in and day out, without ever turning off the engine. Over time, that car would start to show signs of wear and tear. The engine might overheat, the tires would wear down, and eventually, the car would break down completely. This scenario is not unlike what happens to our minds and bodies when we don’t take breaks, especially in high-pressure environments like trading. The Trading Treadmill Trading in financial markets is often described as a high-stakes game. The constant need to monitor markets, make quick decisions, and handle significant financial risks can be incredibly stressful. Imagine being on a treadmill that never stops, and every decision you make can lead to substantial gains or losses. The pressure to perform, the uncertainty, and the fear of making mistakes can take a heavy toll on your mental health. Over time, this can lead to burnout, anxiety, and even depression. The Importance of Taking a Break Just like any other high-stress job, the importance of trading break is high to maintain mental health and overall well-being. Taking a holiday or a gap in trading is not just a luxury; it’s a necessity. Here’s why: Mental Recharge: Our brains are not designed to function at full capacity 24/7. They need time to rest and recharge. Continuous trading without breaks can lead to cognitive fatigue, reducing our ability to think clearly and make sound decisions. A holiday allows the brain to relax, recover, and come back refreshed. Stress Reduction: The constant ups and downs of trading can elevate stress levels. Chronic stress is linked to a host of health problems, including heart disease, high blood pressure, and mental health disorders like depression and anxiety. Taking time off helps lower stress levels and provides a mental reset. Perspective and Reflection: Stepping away from the trading desk allows traders to gain perspective. It’s a chance to reflect on their strategies, learn from their experiences, and make improvements. This reflection can lead to better decision-making and more effective trading strategies in the long run. Everyday Examples Consider the example of athletes. They follow rigorous training schedules but also include rest days in their routines. These rest days are crucial for muscle recovery and overall performance enhancement. Without rest, athletes are more prone to injuries and burnout. Similarly, traders need their “rest days” to perform optimally. Another everyday example is students preparing for exams. Continuous studying without breaks can lead to burnout and reduced performance. However, students who take regular breaks, get enough sleep, and relax tend to perform better academically. The same principle applies to trading. The Consequences of Not Taking Breaks Failing to take breaks can have serious consequences. Prolonged periods of stress without respite can lead to depression. Depression is more than just feeling sad; it can severely impact one’s ability to function, affecting decision-making, focus, and overall quality of life. In the context of trading, this can mean poor trading decisions, significant financial losses, and a downward spiral of stress and mental health issues. Conclusion In conclusion, taking a holiday or a gap in trading is vital for maintaining mental health and overall well-being. Continuous trading without breaks can lead to cognitive fatigue, increased stress levels, and serious mental health issues like depression. By taking regular breaks, traders can recharge their minds, reduce stress, gain perspective, and ultimately make better trading decisions. Just as a car needs regular maintenance to keep running smoothly, our minds need regular breaks to function at their best. So, if you’re a trader, remember to step off the treadmill now and then—your mind and health will thank you.
Understanding Bitcoin’s Scarcity: The Stock-to-Flow Model Explained
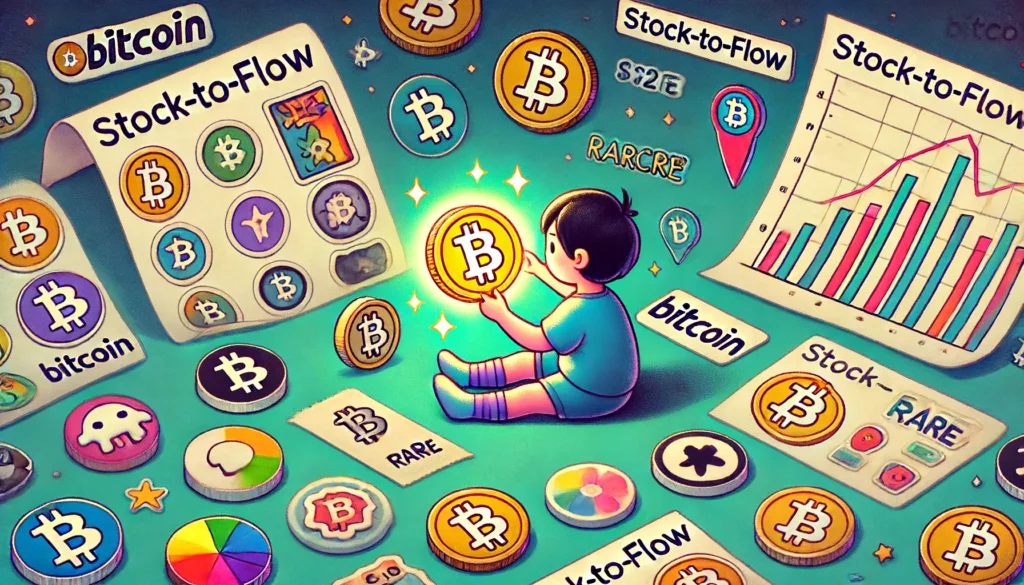
Imagine you’re a child who loves collecting rare stickers. Some stickers are common and easy to find, while others are incredibly rare and much more valuable. Now, let’s think about Bitcoin as one of those rare stickers. This is where the concept of scarcity comes into play, and a fascinating model called the “Stock-to-Flow” (S2F) helps us understand why Bitcoin might be considered so valuable. What is the Stock-to-Flow Model? The Stock-to-Flow model is a way to measure the scarcity of a particular asset. It was originally created by a financial analyst who goes by the pseudonym “PlanB“. He used this model to predict Bitcoin’s price by examining its scarcity. In simple terms, the S2F model compares the current stock (total amount available) of an asset with its flow (the amount produced each year). For example, if we think of gold, the stock is all the gold ever mined, and the flow is how much gold is mined each year. How Does S2F Apply to Bitcoin? Bitcoin is like digital gold. There will only ever be 21 million Bitcoins, which makes it scarce. To create new Bitcoins, miners solve complex puzzles, and this process gets harder over time, slowing down the production rate. This means the flow of new Bitcoins decreases over time, making Bitcoin scarcer and scarcer. The S2F model uses this concept to predict Bitcoin’s price. It suggests that as Bitcoin becomes more scarce, its price should increase. If we look at the chart below, we see Bitcoin’s price (in colourful dots) closely following the S2F model (in grey). We will discuss colours of dots in future. For now, we are trying to understand its concept. This has happened consistently over the past decade. Bitcoin vs. Gold in S2F Terms Let’s compare Bitcoin and gold using the S2F model: Gold: Gold has been around for thousands of years. There’s a large stock of gold already mined, and each year, a relatively small amount is added to this stock. This gives gold a high S2F ratio, indicating it is very scarce. Bitcoin: Bitcoin, although only around since 2009, also has a high S2F ratio. The stock of Bitcoin is increasing at a slower rate because the creation of new Bitcoins is halved approximately every four years (an event known as “halving”). In terms of S2F, Bitcoin’s ratio is expected to surpass that of gold in the future, making it even scarcer. This is one reason why many believe Bitcoin’s price will continue to rise over the long term. The Results and Future of Bitcoin’s S2F Model So far, the S2F model has been remarkably accurate in predicting Bitcoin’s price. This accuracy has made it a popular tool among Bitcoin investors. However, it’s important to remember that no model can predict the future with 100% certainty. Factors such as government regulations, technological changes, and market sentiment can all influence Bitcoin’s price. Looking ahead, the S2F model suggests that Bitcoin’s price will continue to rise as it becomes more scarce. If the past is any indication, and if Bitcoin continues to follow the S2F model, we might see significant price increases in the coming years. As per S2F the price can increase to $400K till Q3 of 2025 but again, no model can predict the future with 100% certainty. Summary In summary, the Stock-to-Flow model is a useful tool for understanding the value of scarce assets like Bitcoin. Created by PlanB, it compares the current stock of an asset with its flow to measure scarcity. Both Bitcoin and gold have high S2F ratios, but Bitcoin’s is expected to surpass gold’s, potentially driving its price higher in the future. While the S2F model has been accurate in the past, always remember that investing in Bitcoin, like any investment, comes with risks. It’s an exciting space, but it’s crucial to stay informed and cautious as the landscape evolves.
Crypto Trends Unveiled: A Beginner’s Guide to Market Movements

Imagine you’re standing at the edge of a vast, bustling marketplace. This marketplace is unlike any other—it doesn’t sell fruits, clothes, or gadgets. Instead, it’s a marketplace for digital currencies, commonly known as cryptocurrencies. The hustle and bustle here are driven by numbers on screens, fluctuating up and down, indicating the value of these cryptocurrencies like Bitcoin and Ethereum. This dynamic environment is what we call the crypto market, and it’s constantly changing, influenced by various trends. What Are Crypto Market Trends? Just like waves in the ocean, the value of cryptocurrencies (or any other financial market, like stocks, commodities, forex etc) rises and falls, creating trends. These trends are essentially the general direction in which the market moves over a period. If you see prices steadily increasing, that’s an upward trend. Conversely, if prices are falling, that’s a downward trend. Understanding these trends helps investors decide when to buy or sell cryptocurrencies. How Are Trends Measured? To make sense of the seemingly random movements in the crypto market, traders use different tools and techniques. Think of these as different types of glasses that help you see the waves more clearly. Let’s look at a few of these tools: SMA, EMA, HMA, and VWMA. We will discuss them separately too. Simple Moving Average (SMA): Imagine you want to know the average temperature in your city over the last week. You’d add up each day’s temperature and divide by seven. That’s essentially what the SMA does with cryptocurrency prices. It takes the average price over a specific number of days. For example, a 10-day SMA adds up the prices of the last 10 days and divides by 10. This helps smooth out daily fluctuations and shows the overall trend. Exponential Moving Average (EMA): The EMA is like the SMA but gives more importance to recent prices. It’s like if you weighed the temperature of the last three days more heavily than the first four days. This makes the EMA more responsive to recent changes in the market, helping traders catch trends earlier. Hull Moving Average (HMA): The HMA goes a step further, aiming to reduce the lag in moving averages. It’s a bit more complex, but you can think of it as a more agile and responsive version of the SMA and EMA. It reacts quickly to changes in price, helping traders spot trends sooner. In our experience it is more responsive to changes than other three. Volume-Weighted Moving Average (VWMA): The VWMA adds another layer by considering the volume of trades. Imagine you’re tracking the popularity of ice cream flavors by not just counting the number of scoops sold but also noting which flavors sold in bulk. The VWMA takes the average price but gives more weight to prices during high trading volumes, offering a clearer picture of where the most activity is. NOTE THAT: In crypto market Moving Average is a LAGGING indicators which means it indicates trend a little late, normally after one or two days. This is because it comes from stocks and forex which are much slower than crypto. So relying heavily on it can result losses. What Starts Trends? Trends in the crypto market can start due to a variety of factors. Here are a few common ones: News and Events: Just like a rumor can spread quickly in a small town, news about cryptocurrencies can significantly impact their prices. Positive news, like a major company accepting Bitcoin, can start an upward trend. Negative news, such as a country banning crypto trading, can trigger a downward trend. Market Sentiment: The general feeling or mood among traders can influence trends. If traders feel optimistic about the market (bullish), they’re likely to buy more, driving prices up. If they’re pessimistic (bearish), they might sell off, causing prices to drop. Technological Developments: Innovations and improvements in blockchain technology, which underpins cryptocurrencies, can also affect trends. A major upgrade to the Bitcoin network, for example, might make it more efficient and secure, leading to a price increase. Regulatory Changes: Governments around the world are still figuring out how to regulate cryptocurrencies. New regulations can have a big impact. Clear, favorable regulations might boost confidence and drive prices up, while strict regulations might have the opposite effect. Conclusion Understanding trends in the crypto market is like learning to read the waves in our bustling marketplace. Tools like SMA, EMA, HMA, and VWMA help traders see the bigger picture and make informed decisions. Trends can start due to news, market sentiment, technological advancements, and regulatory changes. For anyone venturing into the world of cryptocurrencies, keeping an eye on these trends is essential. So, next time you hear about the rise or fall of Bitcoin, you’ll have a better idea of what’s driving those changes and how traders are navigating the ever-changing tides of the crypto market.
