
Market Analysis
Recent fluctuations in Bitcoin’s price and the prevailing market uncertainty have created a challenging environment for investors. This updated Bitcoin analysis offers a comprehensive review of technical indicators across various time frames, alongside an assessment of overall market sentiment.
Over the long term (365 and 90-day frames), Bitcoin remains in an extended downtrend, with its price declining approximately 18.89% over the past year. The bearish momentum has persisted over the last 90 days as well, signaling sustained long-term pressure. The 365-day average RSI hovers around 49.67, indicating a neutral stance, while the Money Flow Index (MFI) near 48.41 suggests moderate financial activity. The negative trend in the MACD histogram, combined with the 200-day Hull Moving Average (HMA) moving downward, underscores ongoing long-term weakness. However, the 50 and 100-day HMAs remain above the current price, hinting at slight short-term improvements, though the overall trajectory still trends downward.
In the mid-term (30-day frame plus HMA), Bitcoin’s price has decreased by roughly 13.21% over the past month and appears to be in a consolidation or transition phase. The 30-day average RSI at about 36.31 reflects weakness but does not indicate a full bearish capitulation. While the 50-day HMA is trending upward, both the 100 and 200-day HMAs point downward, revealing conflicting signals and uncertainty in this intermediate time frame. This suggests the market could move in either direction, though the upward tilt of the 50-day HMA implies a modest chance of recovery.
On the short-term scale (7 days with RSI and Bollinger Bands), the RSI ranged between 41 and 57 over the past week, illustrating movement from weak to moderate strength. Both RSI and MFI remain just below 50 but are trending upward, denoting a neutral to slightly bullish short-term outlook. The recent expansion in Bollinger Bands’ width, particularly price action near the upper band, could indicate a potential breakout or reversal. The price lingering near the upper Bollinger Band points to bullish pressure, but extended proximity may also precede a pullback.
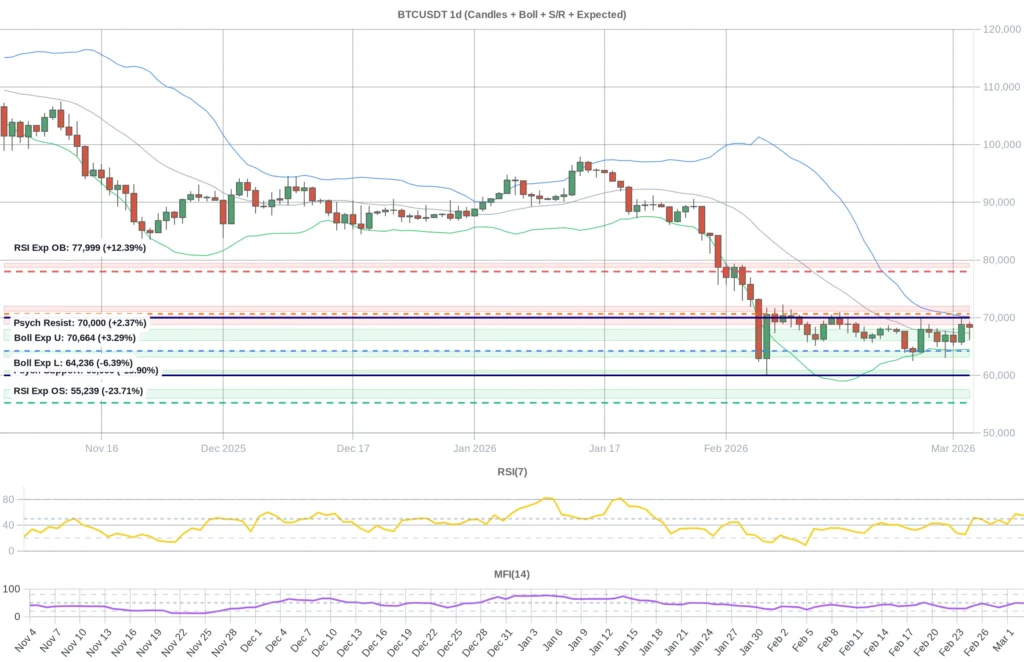
Key support levels are identified between roughly 67,969 and 66,034, representing the nearest defensive zone. Should this fail, secondary support ranges lie between 64,143 and 63,178, followed by additional support levels in the 60,864–60,459 and 57,541–56,018 brackets. Resistance is primarily concentrated in the 68,830 to 70,288 range, closely aligned with the psychological threshold at 70,000. Further resistance levels appear between 71,108–71,997 and 78,738–79,424. A break above the 68,830 resistance could pave the way for a move beyond 70,000, while failure to hold support may increase downward pressure.
Daily predictive indicators suggest that RSI oversold and overbought thresholds lie near 55,239 and 77,998, respectively. The lower and upper Bollinger Band levels are approximately at 64,235 and 70,663. Combined RSI and Bollinger Band levels align closely within these ranges. Currently, the price near 68,338 sits just 3.41% below the upper Bollinger Band and remains far from the oversold RSI region. Given some improvements in the long and mid-term trends, this proximity to the upper Bollinger Band signals mild bullish momentum, though a full entry into the overbought zone seems unlikely. Therefore, a moderate price improvement can be anticipated in the medium term.
Market sentiment indicators show a slightly positive funding rate (0.000015), reflecting modest bullish sentiment. Open interest has risen by 5.63%, indicating growing market participation. The Fear & Greed Index remains within extreme fear territory (11-14), often a contrarian buying signal favoring bulls. News sentiment is mixed: institutional developments such as major banks offering crypto custody services, Paraguay’s hydroelectric mining initiatives, and expanded mining activities by U.S. companies contribute to increased confidence and long-term stability. Regulatory approvals in Abu Dhabi add further support. Conversely, hurdles include the U.S. Senate’s move to restrict CBDCs, geopolitical tensions, and capital outflows from the Iranian crypto market. Harvard Endowment’s shift from Bitcoin to Ethereum also reflects cautious investor positioning.
In summary, despite ongoing long-term pressure on Bitcoin, positive signs are emerging in the medium and short term. Technical indicators and Bollinger Bands suggest the price is approaching a critical zone that could trigger either a breakout or a reversal. Clear support and resistance levels remain pivotal as volatility is expected given prevailing uncertainty. Institutional interest appears to be strengthening confidence; however, geopolitical and regulatory risks continue to limit upward momentum. Accordingly, the current outlook points to a modest medium-term price improvement, while a sustained long-term trend reversal will require firmer foundational support. Investors are advised to adopt a cautious and balanced strategy in light of this comprehensive Bitcoin analysis.
Data Summary
- 1. Time:
2026-03-04 – 00:00 UTC - 2. Prices:
Open: 68830.06000000High: 69258.08000000Low: 66158.00000000Close: 68338.00000000
- 8. Supports:
S1: 67969.65000000 – 66034.50000000S2: 64143.56000000 – 63178.32000000S3: 60864.99000000 – 60459.90000000S4: 57541.1 – 56018
- 9. Resistances:
R1: 68830.06000000 – 70288.00000000R2: 71108.00000000 – 71997.02000000R3: 78738.6 – 79424
- 10. Psychological Support:
60000.00000000
- 11. Psychological Resistance:
70000.00000000
- 3. Last 5 days’ closing prices:
2026-02-27: 65872.100000002026-02-28: 66973.260000002026-03-01: 65776.470000002026-03-02: 68830.060000002026-03-03: 68338.00000000
- 4. Volume:
BTC: 24972.2418USD: $1691848669.9430
- 5. Number of trades:
7648119
- 6. Indicators:
RSI: 54.8200MFI: 48.4100BB Upper: 70196.02000000BB Lower: 64503.16000000
- 7. Moving Averages:
SMA:7=67323.3000000014=66934.3800000021=67349.5900000030=68470.1800000050=76870.68000000100=83249.34000000200=96649.50000000EMA:
7=67392.4200000014=67584.0500000021=68632.4100000030=70477.1300000050=74524.10000000100=82154.56000000200=89988.53000000HMA:
7=68450.6800000014=67381.4300000021=66601.5200000030=66144.8400000050=62675.23000000100=65192.88000000200=70840.80000000 - 12. Funding Rate:
0.0015% (Technically Positive)
- 13. Open Interest:
82214.7510
- 14. Fear & Greed Index:
14 (Extreme Fear)
Disclaimer: This market analysis is generated by AI based on historical BTC data and sentiment indicators. Use it as a reference, not financial advice.
