

Market Analysis
The current Bitcoin market is characterized by a complex interplay of factors influencing its price direction. This updated analysis provides a comprehensive overview based on technical indicators, market sentiment, and recent news developments.
Over the past year, Bitcoin’s long-term trend (examined over 365 and 90 days) has been clearly bearish, with a decline of approximately 22.38%. The 365-day timeframe shows a market position near 0.13, signaling underlying weakness, while the 90-day frame reflects a similar downtrend with a 26.33% drop and a position of 0.23. Despite this sustained downward pressure, signs of potential reversal are emerging. The price currently hovers around the 50 and 100-day Hull Moving Averages (HMA), and the 50-day HMA’s positive slope suggests some easing in the long-term bearish momentum. Additionally, a positive MACD histogram reading (785.5) supports the notion that selling pressure is diminishing, though a confirmed bullish trend has yet to materialize.
In the mid-term perspective, covering roughly 30 days, Bitcoin has experienced a 10.57% decline and appears to be in a transitional or range-bound phase. Key oscillators such as RSI and MFI average around 34.91 and 37.82 respectively, indicating a weak but uncertain market mood. The positive slope of the 50-day HMA and the price trading above both the 50 and 100-day HMAs point to a slight bullish bias. However, the negative slopes observed in the 100 and 200-day HMAs reveal lingering instability. The MACD histogram’s mixed signals—averaging negative at -325 but recently trending positive—underscore the market’s indecision and suggest that further confirmation is needed to determine the next price direction.
Short-term price action over the past 7 days shows higher volatility, with the RSI7 at 57.59 indicating moderate to strong bullish momentum. The MFI14 near 49.79 reflects balanced liquidity and capital flow. Current prices sit close to the upper Bollinger Band (positioned at 0.754), signaling bullish momentum in the near term. However, while RSI remains above the neutral 50 mark, the combined readings from MACD and Bollinger Bands imply potential for some range-bound movement. Overall, despite increased short-term volatility, current technical conditions support a positive outlook for Bitcoin in the immediate future.
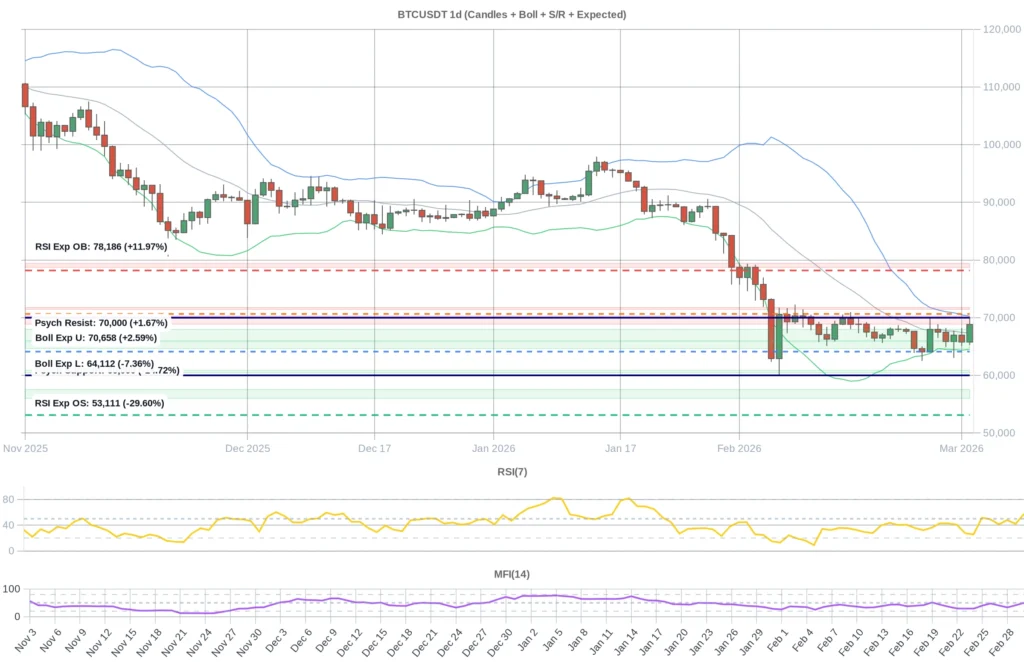
Key support and resistance levels play a critical role in defining potential price floors and ceilings. The primary support zone (S1) lies between $67,969 and $66,034, providing a strong buffer against further declines. If broken, secondary support ranges extend down to approximately $65,872–$64,666 (S2), followed by $60,865–$60,460 (S3). On the upside, resistance is encountered between $68,892 and $70,288 (R1), near recent highs. Should this barrier be surpassed, the next target range is $71,446 to $71,758 (R2). The psychological $70,000 mark remains pivotal, as price oscillations around this level highlight ongoing market uncertainty.
Daily expected levels based on combined RSI and Bollinger Band indicators point to an oversold threshold near $53,111 and an overbought zone near $78,185. The Bollinger Bands themselves indicate a lower boundary at $64,111 and an upper boundary at $70,658. Currently trading around $68,830—close to the upper Bollinger Band with a distance of roughly 2.57%—Bitcoin exhibits a tendency toward short-term bullish momentum. While the price is moving toward the upper band, it remains well below overbought levels, reducing the immediate risk of a sharp reversal.
From a sentiment perspective, funding rates are negative (-0.000011), reflecting the presence of bearish positions in the short term. Conversely, open interest has risen by 0.6095%, signaling growing market participation. The Fear & Greed Index hovers near extreme fear levels (between 11 and 14), indicating a dominant sense of caution among investors. Historically, such fear zones have often presented buying opportunities, especially for long-term investors. Recent geopolitical tensions in the Middle East have reinforced Bitcoin’s status as a safe haven, pushing prices above $70,000. Large institutional purchases exceeding $200 million further bolster market support. However, concerns persist due to a record $9 billion ETF outflow and proposed crypto taxation in Turkey, which add layers of uncertainty. Security issues and substantial crypto outflows from Iran have also contributed to market volatility. Overall, bullish and bearish forces coexist, but prevailing fear and geopolitical dynamics underpin near- and mid-term price support.
In conclusion, Bitcoin’s current market environment is intricate and balanced. Despite a persistent long-term downtrend, there are clear signs of bullish momentum emerging in the short and mid-term horizons. Technical indicators such as RSI, Bollinger Bands, and Hull Moving Averages suggest the potential for price gains, especially as the asset approaches the upper Bollinger Band alongside increasing open interest. Nonetheless, investors should remain cautious of lingering risks from ETF outflows, regulatory concerns, and security challenges. The prevailing fear in the market may open buying opportunities, but given the rapidly evolving conditions, prudent risk management is essential. This analysis points to the likelihood of price improvement in the near and medium term, though sustained long-term stability will require further positive developments.
Data Summary
- 1. Time:
2026-03-03 – 00:00 UTC - 2. Prices:
Open: 65776.48000000High: 70096.00000000Low: 65259.21000000Close: 68830.06000000
- 8. Supports:
S1: 67969.65000000 – 66034.50000000S2: 65872.10000000 – 64666.00000000S3: 60864.99000000 – 60459.90000000S4: 57541.1 – 56018
- 9. Resistances:
R1: 68892.43000000 – 70288.00000000R2: 71446.62000000 – 71758.00000000R3: 78738.6 – 79424
- 10. Psychological Support:
60000.00000000
- 11. Psychological Resistance:
70000.00000000
- 3. Last 5 days’ closing prices:
2026-02-26: 67485.180000002026-02-27: 65872.100000002026-02-28: 66973.260000002026-03-01: 65776.470000002026-03-02: 68830.06000000
- 4. Volume:
BTC: 32010.3843USD: $2164578841.8459
- 5. Number of trades:
8397526
- 6. Indicators:
RSI: 57.5900MFI: 49.7900BB Upper: 70261.05000000BB Lower: 64486.07000000
- 7. Moving Averages:
SMA:7=66711.8900000014=66874.7800000021=67373.5600000030=68757.8500000050=77329.84000000100=83434.26000000200=96890.13000000EMA:
7=67077.2300000014=67468.0600000021=68661.8500000030=70624.6600000050=74776.60000000100=82433.69000000200=90206.12000000HMA:
7=67310.4900000014=66727.8800000021=66223.1800000030=65913.1600000050=62347.28000000100=65771.73000000200=71221.44000000 - 12. Funding Rate:
-0.0011% (Technically Positive)
- 13. Open Interest:
77832.7760
- 14. Fear & Greed Index:
10 (Extreme Fear)
Disclaimer: This market analysis is generated by AI based on historical BTC data and sentiment indicators. Use it as a reference, not financial advice.
