

Market Analysis
Recent developments in the Bitcoin market present a complex picture, with various technical and fundamental factors sending mixed signals about the future price direction. This analysis offers a comprehensive review of long-term, medium-term, and short-term trends, along with market sentiment and key support and resistance levels.
Over the long term, examining the 365-day and 90-day windows reveals a clear downtrend. Bitcoin has experienced a significant decline, with prices falling roughly 30% over the past year and about 22% in the last 90 days. Average readings from indicators like RSI and MFI suggest prevailing market weakness. Although the MACD histogram shows a faint positive presence, hinting at a possible short-term bounce, it lacks strong conviction. The Hull Moving Average (HMA) also supports a bearish outlook: the 50-day HMA remains below the current price, while the 100-day and 200-day HMAs are turning downward, reinforcing the long-term downtrend. Despite occasional price fluctuations, the overall trajectory remains downward in this extended timeframe.
In the medium term, focusing on the 30-day window, Bitcoin’s trend similarly leans bearish, with about a 20% price drop. RSI and MFI averages hover near 30, indicating a fragile market condition. The 50-day HMA is currently above the price, offering some short-term support, but both the 100-day and 200-day HMAs continue their downward slope, suggesting limited strength ahead. The MACD histogram’s current positive readings may signal temporary relief; however, sustaining this momentum is uncertain. Therefore, the medium-term outlook points to a continuing downtrend with possible brief recoveries, but overall downward pressure is likely to persist.
In the short term, over the past seven days, the 7-day RSI has risen from 25.6 to 47.9, indicating some easing of recent weakness. With the RSI approaching 50 and price movements contained within the Bollinger Bands, there is scope for moderate relief. The Bollinger Bands have not widened significantly, reflecting relative stability in market volatility. Recent price action near the lower band suggests an oversold condition, followed by a modest rebound. Consequently, short-term prospects are cautiously optimistic, with expected price fluctuations but no major trend shift.
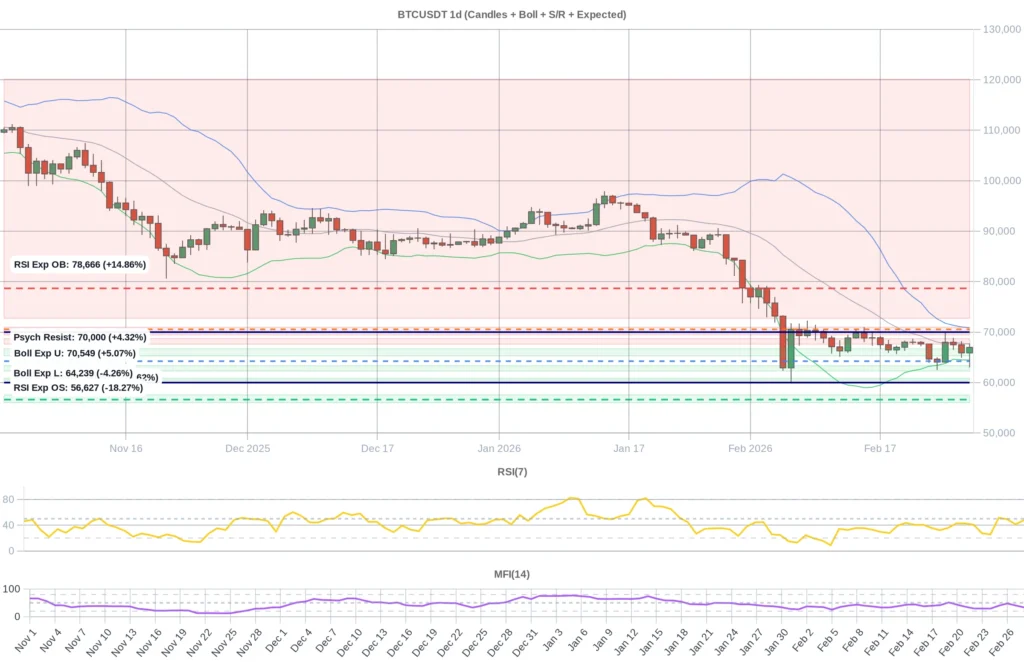
Key support zones to watch are between 65,300 and 66,700, 62,300 and 63,300, and 60,450 to 60,850. A failure to hold the first support band could lead to tests of the subsequent lower levels. On the resistance side, notable ranges lie between 67,600 and 68,700, 69,400 and 71,000, and a broad zone from 72,700 up to 120,000. The psychological resistance around 70,000 remains significant. Currently trading near 67,000, Bitcoin is positioned just above the first support range, which may provide temporary stability. Should this range hold, a short-term bounce is possible; otherwise, downward pressure could intensify.
Daily predictive levels based on combined RSI and Bollinger Band indicators suggest the oversold threshold near 56,626 and the overbought boundary close to 78,665. Corresponding Bollinger Band lower and upper limits are around 64,239 and 70,549, respectively. The current price near 67,000 sits close to the lower Bollinger Band, indicating a tendency toward an oversold state but not reaching full oversold conditions. Considering the prevailing long- and medium-term downtrends, the likelihood of pushing into the overbought zone soon is slim, while a moderate move toward the lower band remains plausible. This aligns with expectations for short-term price stability and potential relief.
From a sentiment perspective, recent negative funding rates indicate rising short positions and increasing market pressure. Open interest has shown a slight uptick, reflecting some participant engagement, yet overall bearish sentiment endures. The Fear & Greed Index remains near extreme fear levels (between 8 and 13), mirroring widespread market anxiety and pessimism. News flow has predominantly been negative, citing Bitcoin’s worst five-month slump, macroeconomic uncertainties, a three-month low in funding rates, and mounting regulatory scrutiny, especially concerning stablecoins. Geopolitical tensions have temporarily influenced prices, though Bitcoin has demonstrated relative resilience. On the positive side, there is growing institutional interest in tokenized equity, signaling market maturation and diversification in investment avenues. Overall, the emotional climate is dominated by fear and uncertainty, prompting cautious behavior among investors.
In conclusion, Bitcoin’s current market environment is characterized by a clear bearish bias in both the long and medium terms, while short-term indicators suggest some stabilization and limited relief potential. Technical indicators and daily predictive levels point to prices near the lower Bollinger Band, indicating proximity to oversold conditions, yet prevailing negative sentiment and funding pressures restrain upward momentum. Key support levels could prevent further declines, but breaking these would expose Bitcoin to deeper losses. The broader macroeconomic and regulatory landscape continues to weigh heavily on sentiment. Investors are advised to maintain caution, recognizing that despite short-term reprieves, the risk of extended downtrends remains significant. While there are some opportunities in the short term, a prudent, measured approach is recommended for medium-term positioning, with a general expectation that price direction favors the downside for now.
Data Summary
- 1. Time:
2026-03-01 – 00:00 UTC - 2. Prices:
Open: 65872.09000000High: 67760.00000000Low: 63030.00000000Close: 66973.26000000
- 8. Supports:
S1: 66698.33000000 – 65302.67000000S2: 63339.99000000 – 62302.00000000S3: 60864.99000000 – 60459.90000000S4: 57541.1 – 56018
- 9. Resistances:
R1: 67620.01000000 – 68698.70000000R2: 69436.43000000 – 70983.00000000R3: 72736.42000000 – 120134.08000000
- 10. Psychological Support:
60000.00000000
- 11. Psychological Resistance:
70000.00000000
- 3. Last 5 days’ closing prices:
2026-02-24: 64058.150000002026-02-25: 67988.040000002026-02-26: 67485.180000002026-02-27: 65872.100000002026-02-28: 66973.26000000
- 4. Volume:
BTC: 22548.7165USD: $1462864408.2616
- 5. Number of trades:
5268514
- 6. Indicators:
RSI: 47.9200MFI: 33.3200BB Upper: 70855.35000000BB Lower: 64450.05000000
- 7. Moving Averages:
SMA:7=66382.3100000014=67097.5300000021=67652.7000000030=69704.3500000050=78268.08000000100=83786.89000000200=97387.83000000EMA:
7=66731.7700000014=67486.5300000021=68931.8900000030=71091.3200000050=75396.57000000100=83050.57000000200=90668.64000000HMA:
7=66947.8800000014=66194.7200000021=66039.0400000030=65709.8500000050=61944.75000000100=67089.47000000200=72024.90000000 - 12. Funding Rate:
-0.0043% (Technically Positive)
- 13. Open Interest:
79180.5960
- 14. Fear & Greed Index:
11 (Extreme Fear)
Disclaimer: This market analysis is generated by AI based on historical BTC data and sentiment indicators. Use it as a reference, not financial advice.
