

Market Analysis
Bitcoin’s current market landscape presents a nuanced and intriguing picture for investors, characterized by price fluctuations across multiple timeframes and mixed technical signals. This analysis explores Bitcoin’s potential trajectory by examining various indicators alongside recent market developments.
Over the long term, Bitcoin remains entrenched in a clear downtrend, as reflected in the data spanning the past 365 and 90 days. Prices have declined approximately 31.77% over the last year and 27.1% in the past three months, underscoring a persistent bearish environment. Momentum indicators such as the RSI and MFI hover below mid-levels, signaling ongoing market weakness. Although the 50-day Hull Moving Average (HMA) currently sits below the price with a modest upward slope suggesting some short-term resilience, the 100- and 200-day HMAs continue to slope downward, reinforcing the long-term bearish outlook. Price ranges remain wide, indicating heightened volatility and a lack of a definitive trend.
In the medium term, covering the last 30 days, Bitcoin has experienced a 22.18% decline and remains in a sustained downtrend. Both RSI and MFI indicators are positioned below 50, confirming bearish momentum. The 50-day HMA is close to the current price with a slight positive slope, reflecting occasional attempts at recovery. However, the downward turn of the 100- and 200-day HMAs signals ongoing weakness at this intermediate scale. This suggests that while there may be short bursts of upward movement, the overall medium-term trend remains bearish.
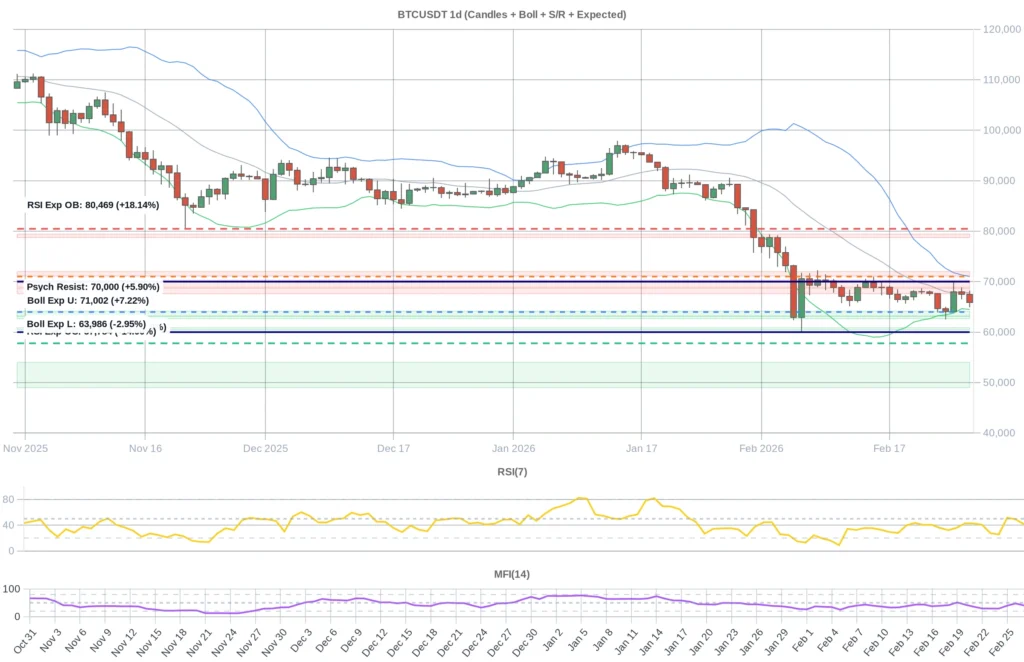
On a short-term basis, looking at the past seven days, Bitcoin’s price has dropped by 3.09%. The 7-day RSI stands at 41.4, indicating a neutral to mildly bearish stance. Price action near the lower Bollinger Band (around $64,502), with the current price close to $65,872, hints at a potential rebound in the short term. Both RSI and MFI remain below 50, with RSI trending downward, reflecting near-term selling pressure. Meanwhile, the MACD histogram is positive but weak, suggesting some limited bullish momentum but without strong conviction.
Key support levels are identified between approximately $64,143 and $63,178, $63,152 and $62,670, and $60,864 and $60,459. Falling below these zones could open the door to deeper declines, with the next major support range lying between $54,018 and $49,000. The psychological level of $60,000 also serves as a critical support point. Resistance levels cluster around $67,620 to $68,698, $68,892 to $70,288, and $71,108 to $71,997, with the $70,000 mark representing a significant psychological barrier. Sustained movement above $67,620 could shift focus toward the $68,892 to $70,288 range, while failure to hold supports may intensify the bearish momentum.
Based on daily expected levels derived from RSI, Bollinger Bands, and combined indicator assessments, the oversold threshold is near $57,784, whereas the overbought level approaches $80,468. The lower and upper Bollinger Band boundaries currently lie around $63,986 and $71,001, respectively. Given that the current price is close to the lower band, a short-term rebound is plausible, particularly if longer-term trends show signs of stabilization. However, considering the prevailing long-term downtrend, any rally is likely to be limited and temporary.
Market sentiment reflects a state of balance, with the funding rate hovering near zero (-0.000007), indicating neutral positioning among traders. Open interest has declined by 1.3%, adding to signals of market weakness. The Fear & Greed Index remains extremely low, fluctuating between 5 and 13, signaling intense fear which historically can present buying opportunities as institutional investors may choose to accumulate. News flow is mixed: substantial inflows totaling $1.1 billion into U.S. spot Bitcoin ETFs and purchases of downside protection highlight growing institutional confidence, a positive development. Conversely, reports of significant losses from companies like MARA and technical warnings of potential sharp declines hint at continued risks. Regulatory advances, including the introduction of regulated stablecoins in Germany and the U.S. SEC Chair’s announcement of possible Bitcoin ETF participation by 2026, offer hope for market clarity and innovation. Still, setbacks such as crypto security lapses in South Korea raise caution. Overall, institutional investment and regulatory progress foster a cautiously optimistic environment, though technical and sector-specific challenges remain.
In summary, Bitcoin’s current market condition reflects a complex balance: long- and medium-term trends remain distinctly bearish, while short-term signals suggest a possible rebound. Technical indicators and expected price levels near Bollinger Bands’ lower range may provide buying opportunities in the near term. Nonetheless, given the extended downtrend and ongoing medium-term weaknesses, these rallies should be approached with caution. Positive institutional developments and regulatory clarity add a constructive dimension, but mining sector difficulties and bearish technical alerts warrant vigilance. Investors are advised to capitalize on short-term opportunities while maintaining a close watch on prevailing long-term dynamics to better anticipate Bitcoin’s price movements. This detailed analysis aims to offer valuable insights into Bitcoin’s potential direction in the evolving market environment.
Data Summary
- 1. Time:
2026-02-28 – 00:00 UTC - 2. Prices:
Open: 67485.19000000High: 68216.80000000Low: 64914.46000000Close: 65872.10000000
- 8. Supports:
S1: 64143.56000000 – 63178.32000000S2: 63152.01000000 – 62670.00000000S3: 60864.99000000 – 60459.90000000S4: 54018.8 – 49000
- 9. Resistances:
R1: 67620.01000000 – 68698.70000000R2: 68892.43000000 – 70288.00000000R3: 71108.00000000 – 71997.02000000R4: 78738.6 – 79424
- 10. Psychological Support:
60000.00000000
- 11. Psychological Resistance:
70000.00000000
- 3. Last 5 days’ closing prices:
2026-02-23: 64656.020000002026-02-24: 64058.150000002026-02-25: 67988.040000002026-02-26: 67485.180000002026-02-27: 65872.10000000
- 4. Volume:
BTC: 21228.5842USD: $1412033823.5620
- 5. Number of trades:
3856064
- 6. Indicators:
RSI: 41.4100MFI: 40.3500BB Upper: 71023.45000000BB Lower: 64502.53000000
- 7. Moving Averages:
SMA:7=66525.5500000014=67301.0700000021=67762.9900000030=70293.5800000050=78741.44000000100=83983.53000000200=97627.92000000EMA:
7=66651.2800000014=67565.5000000021=69127.7500000030=71375.3200000050=75740.38000000100=83375.36000000200=90906.79000000HMA:
7=67249.8300000014=66089.1600000021=65953.8100000030=65596.9500000050=61845.60000000100=67800.42000000200=72438.04000000 - 12. Funding Rate:
-0.0007% (Technically Positive)
- 13. Open Interest:
79068.2390
- 14. Fear & Greed Index:
13 (Extreme Fear)
Disclaimer: This market analysis is generated by AI based on historical BTC data and sentiment indicators. Use it as a reference, not financial advice.
