

Market Analysis
In recent days, various factors have influenced Bitcoin’s price, complicating decision-making for investors. This analysis provides a detailed overview of Bitcoin’s current state by examining both technical and fundamental aspects.
Over the long term (365/90-day periods), Bitcoin has been in a clear downtrend. Over the past year, the price has declined by approximately 30%, indicating sustained downward pressure in the market. Key indicators like RSI and MFI averages remain below moderate levels, reflecting weakness among buyers. Although the MACD histogram shows some positivity, its impact is limited, as the slopes of the 50, 100, and 200-day Hull Moving Averages (HMA) are negative—especially the 100 and 200-day HMAs—signaling ongoing long-term weakness. This suggests that Bitcoin’s long-term trend continues to face pressure, with no significant turnaround expected in the near future.
In the mid-term (30-day regime), Bitcoin has also experienced a roughly 24% decline, confirming a strong downtrend. While the 50-day HMA remains above the current price, its downward slope points to continued mid-term weakness. The MACD histogram has shown some recent improvement, yet overall mid-term momentum remains bearish. Both RSI and MFI averages are at weak levels, reinforcing negative sentiment for the mid-term. However, recent price movements hint at a potential short-term relief rally within this otherwise weak mid-term environment.
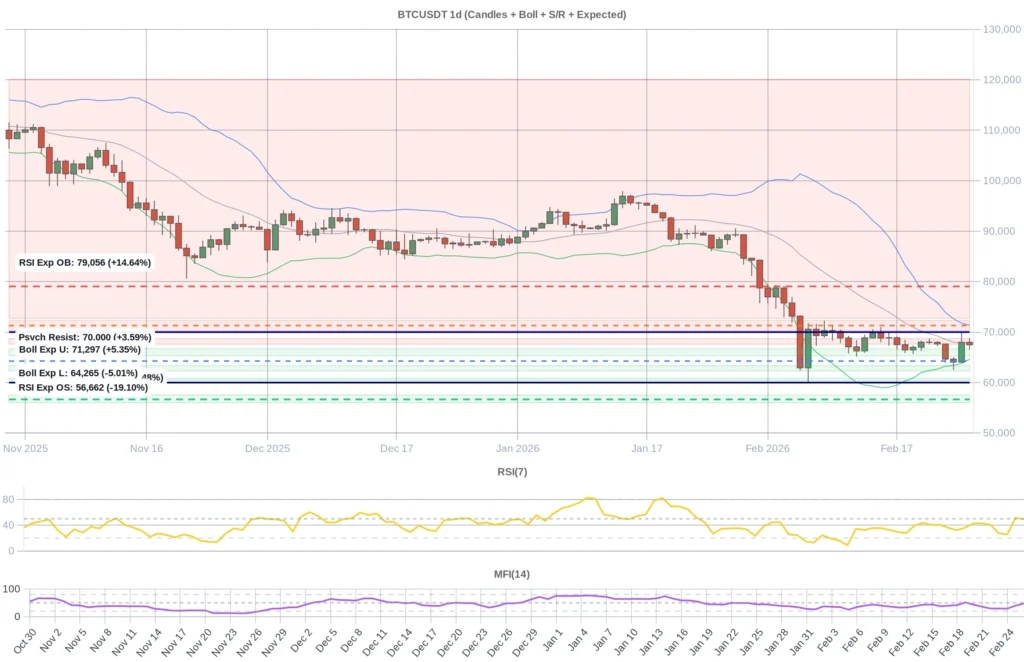
On the short-term horizon (7 days), the RSI7 is hovering near 49, placing it within a neutral zone, with attempts recently made to push above 50. The 14-day MFI is around 47, suggesting some buyer interest. Price action remains stable within the Bollinger Bands, moving mostly between the middle and lower bands, indicating low volatility and no immediate breakout. The upward movement of the 7-day RSI from below, combined with prices near the midline of the Bollinger Bands, points to a possible short-term upward trend, although this momentum is not yet fully established.
Key support levels to watch are between approximately 66,700 and 65,300 (S1), followed by 63,300 to 62,300 (S2). Should S1 fail, S2 could act as a strong support zone to prevent further declines. Additional support exists below these levels (S3 and S4), serving as further cushions against downside risk. On the resistance side, important levels include roughly 67,600 to 68,700 (R1) and 70,300 to 72,300 (R2). Breaking above R1 could reinforce short-term bullish momentum, while approaching R2 is likely to present significant resistance. The psychological barrier near 70,000 remains a critical hurdle that may prove difficult to surpass.
Based on predictive technical levels, the RSI oversold threshold is near 56,662, while the overbought mark is around 79,056. According to Bollinger Bands, the lower band sits near 64,264 with the upper band at about 71,342. The combined RSI and Bollinger levels fall within this range. The current price, close to 67,485 and near the lower Bollinger Band, suggests that Bitcoin is approaching an oversold zone, increasing the likelihood of a short-term rebound. Nevertheless, considering the prevailing long and mid-term trends, the strength of this rebound is expected to be moderate, and pushing prices toward the upper overbought levels may be challenging.
Market sentiment indicators show a slightly positive funding rate (0.000040), reflecting mild bullishness. Open interest has increased by 0.39%, indicating a modest rise in market engagement. The Fear & Greed Index remains near extreme fear levels (9-11), often signaling a potential buying opportunity in the short term, as this zone is typically viewed as a value area. News flow presents a mixed picture: recent legislation in Indiana and substantial institutional investments in U.S. spot Bitcoin ETFs are boosting institutional interest, which bodes well for the medium and long term. Additionally, regulatory clarity emerging from the U.S. Blockchain Innovation Act and Federal Reserve actions supports market stability. On the downside, volatility in the tech sector and political uncertainties in Colombia are exerting short-term pressure. Financial issues in the mining sector also pose challenges, while stronger performance among altcoins suggests relatively better sentiment outside Bitcoin.
In summary, the latest analysis highlights persistent pressure on Bitcoin’s long and mid-term outlook, though short-term signs point to a modest recovery. Technical indicators indicate that the price is near oversold levels, suggesting some potential for a short-term bounce, albeit with limited strength. Institutional investment and regulatory clarity provide encouraging factors for the longer term, but near-term risks include tech market volatility and geopolitical uncertainties. Overall, the current environment calls for a cautious yet optimistic approach. Investors should anticipate short-term fluctuations while watching for possible stabilization and improvement in Bitcoin’s position over the medium and long term. A careful strategy expecting short-term relief alongside potential mid-term consolidation is advisable.
Data Summary
- 1. Time:
2026-02-27 – 00:00 UTC - 2. Prices:
Open: 67988.04000000High: 68860.00000000Low: 66500.00000000Close: 67485.18000000
- 8. Supports:
S1: 66698.33000000 – 65302.67000000S2: 63339.99000000 – 62302.00000000S3: 60864.99000000 – 60459.90000000S4: 57541.1 – 56018
- 9. Resistances:
R1: 67620.01000000 – 68698.70000000R2: 70330.38000000 – 72271.41000000R3: 72736.42000000 – 120134.08000000
- 10. Psychological Support:
60000.00000000
- 11. Psychological Resistance:
70000.00000000
- 3. Last 5 days’ closing prices:
2026-02-22: 67643.400000002026-02-23: 64656.020000002026-02-24: 64058.150000002026-02-25: 67988.040000002026-02-26: 67485.18000000
- 4. Volume:
BTC: 20737.7779USD: $1404774665.5646
- 5. Number of trades:
5426137
- 6. Indicators:
RSI: 49.1200MFI: 47.6800BB Upper: 71342.83000000BB Lower: 64631.54000000
- 7. Moving Averages:
SMA:7=66832.3900000014=67514.0600000021=67987.1900000030=71074.5100000050=79245.99000000100=84240.36000000200=97869.21000000EMA:
7=66911.0100000014=67826.0200000021=69453.3100000030=71754.8500000050=76143.17000000100=83728.96000000200=91158.39000000HMA:
7=66936.2200000014=65995.7600000021=65990.9000000030=65518.5400000050=61828.45000000100=68547.65000000200=72859.22000000 - 12. Funding Rate:
0.004% (Technically Positive)
- 13. Open Interest:
80112.5400
- 14. Fear & Greed Index:
11 (Extreme Fear)
Disclaimer: This market analysis is generated by AI based on historical BTC data and sentiment indicators. Use it as a reference, not financial advice.
