

Market Analysis
Bitcoin has experienced significant price fluctuations in recent days, profoundly impacting market sentiment and technical indicators. This analysis provides a comprehensive overview of the current state of Bitcoin by examining various timeframes and key technical signals, aiming to enhance understanding and offer more accurate price predictions.
Over the long term, spanning the past year and ninety days, Bitcoin has exhibited a bearish trend, with prices dropping nearly 30%. Within the 365-day window, the price declined from approximately 126,200 to 60,000, clearly indicating a sustained downtrend. The 90-day period also saw a roughly 25% decrease. Key momentum indicators like the RSI and MFI remain below mid-levels, signaling weak buying pressure. Additionally, the Hull Moving Average shows a negative slope, and the price currently sits below the 50, 100, and 200-day moving averages, reinforcing the long-term bearish outlook. However, recent days have brought some stabilization and slight upticks in price, suggesting the potential beginnings of a reversal.
In the medium term, analyzed over the last 30 days, Bitcoin’s price has fallen by about 24%, reflecting a clear downward bias. The Hull Moving Average remains below the 50-day moving average with a negative slope, underscoring ongoing selling pressure. The RSI and MFI continue to point toward weak buying interest, although the MACD histogram displays faintly positive signals. This indicates the medium-term trend remains bearish, albeit with some technical relief emerging.
Short-term price movements over the past week have been notably volatile. Specifically, on February 23rd and 24th, Bitcoin experienced sharp declines followed by a sudden recovery on February 25th. The 7-day RSI fluctuated between 25 and 51, initially indicating an oversold condition and subsequently shifting toward neutral to stronger buying momentum. The widening of Bollinger Bands further highlights elevated short-term volatility. Price action moving above the Bollinger Bands’ midline provides a cautiously optimistic short-term signal.
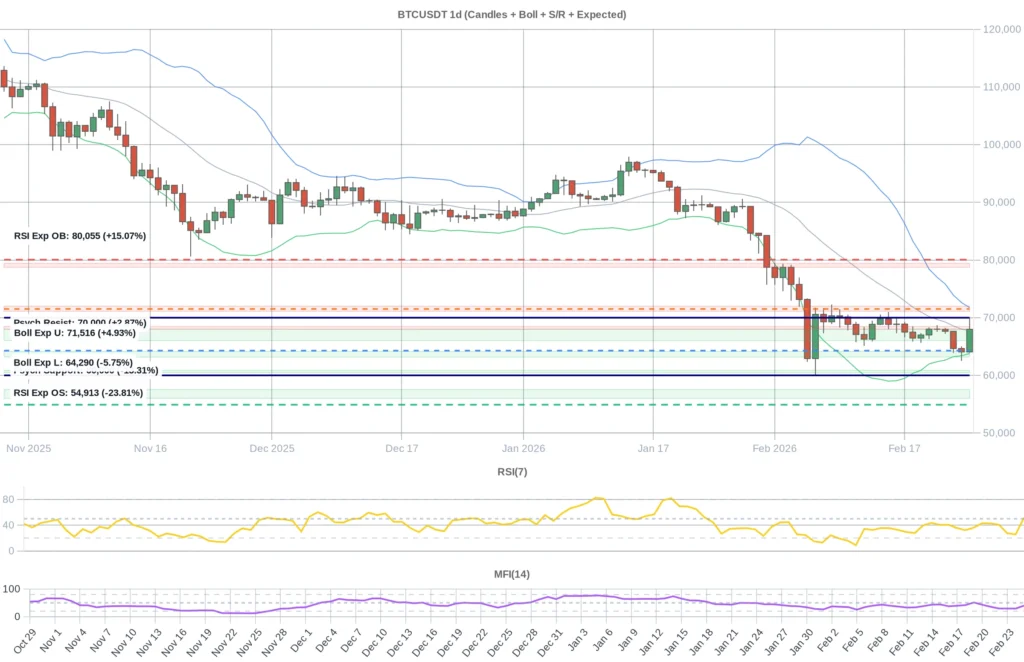
Key support levels are identified roughly between 67,970 and 66,030 (S1), 64,140 to 63,180 (S2), and 60,865 to 60,460 (S3). Should the price fall below S1, it may test S2 and potentially S3. On the upside, resistance zones are noted around 68,020 to 68,475 (R1) and 71,100 to 71,995 (R2). Resistance near 68,000 appears particularly strong, and surpassing this level could open the way for a push toward 71,000. The psychological barrier at 70,000 also plays a significant role in market dynamics.
According to daily predictive models combining RSI, Bollinger Bands, and a double confirmation level (CPL), the oversold RSI threshold stands near 54,913, and the overbought level is around 80,055. Bollinger Bands’ lower and upper boundaries are approximately 64,290 and 71,515, respectively, with combined indicators pointing toward similar ranges. With the current price near 67,820, close to the upper Bollinger Band, upward movement appears limited in the short term. Given the prevailing medium and long-term bearishness, the odds of a sustained rally remain moderate, although short-term recoveries could push prices up to resistance zones.
Market sentiment shows a near-neutral funding rate around zero (-0.000010), signaling equilibrium between buyers and sellers. Open interest has seen a slight uptick of 0.22%, reflecting marginally increased buying activity. The Fear & Greed Index remains in the extreme fear zone (between 8 and 11), often considered a potential buying opportunity. News flow is mixed: optimism stems from the revival of Bitcoin ETFs and the elimination of miner capital costs, while concerns linger over ongoing regulatory scrutiny of Binance and stablecoin regulations in the UK, which could weigh on prices. Institutional interest is highlighted by the robustness of MicroStrategy’s stock, though significant Ethereum sales by Vitalik Buterin have introduced some uncertainty among altcoin investors. Overall, the market mood is cautious yet cautiously optimistic.
In summary, the analysis points to a predominantly bearish outlook for Bitcoin over the long and medium terms, with potential for short-term recovery. Technical indicators and predictive levels suggest that price action will likely remain confined between approximately 68,000 and 71,500, where resistance is notably strong. Market sentiment is cautiously positive, largely supported by ETF developments and miner-related news, but regulatory and legal challenges could exert downward pressure. Investors are advised to exercise careful risk management, taking advantage of short-term opportunities while remaining mindful of the broader bearish trends. Moderate gains are possible in the near term, but a full recovery will require more convincing positive signals. Given the current environment, a balanced and prudent investment approach is recommended.
Data Summary
- 1. Time:
2026-02-26 – 00:00 UTC - 2. Prices:
Open: 64058.15000000High: 69988.83000000Low: 63913.27000000Close: 67988.04000000
- 8. Supports:
S1: 67969.65000000 – 66034.50000000S2: 64143.56000000 – 63178.32000000S3: 60864.99000000 – 60459.90000000S4: 57541.1 – 56018
- 9. Resistances:
R1: 68020.01000000 – 68476.22000000R2: 71108.00000000 – 71997.02000000R3: 78738.6 – 79424
- 10. Psychological Support:
60000.00000000
- 11. Psychological Resistance:
70000.00000000
- 3. Last 5 days’ closing prices:
2026-02-21: 67975.930000002026-02-22: 67643.400000002026-02-23: 64656.020000002026-02-24: 64058.150000002026-02-25: 67988.04000000
- 4. Volume:
BTC: 30749.9926USD: $2064089702.8444
- 5. Number of trades:
7096715
- 6. Indicators:
RSI: 51.6900MFI: 39.8400BB Upper: 71760.90000000BB Lower: 63777.72000000
- 7. Moving Averages:
SMA:7=66763.6100000014=67427.4200000021=67769.3100000030=71800.0100000050=79723.57000000100=84495.12000000200=98107.06000000EMA:
7=66719.6100000014=67878.4600000021=69650.1300000030=72049.3100000050=76496.56000000100=84057.12000000200=91396.31000000HMA:
7=65053.0100000014=65773.8400000021=66080.7600000030=65398.6500000050=61860.49000000100=69316.96000000200=73283.58000000 - 12. Funding Rate:
-0.001% (Technically Positive)
- 13. Open Interest:
79798.7870
- 14. Fear & Greed Index:
11 (Extreme Fear)
Disclaimer: This market analysis is generated by AI based on historical BTC data and sentiment indicators. Use it as a reference, not financial advice.
