
Market Analysis
Bitcoin is currently experiencing a notable decline in value accompanied by considerable market uncertainty. However, technical indicators and market sentiment reveal some conflicting signals. Investors are advised to exercise caution and focus primarily on short- to medium-term trends.
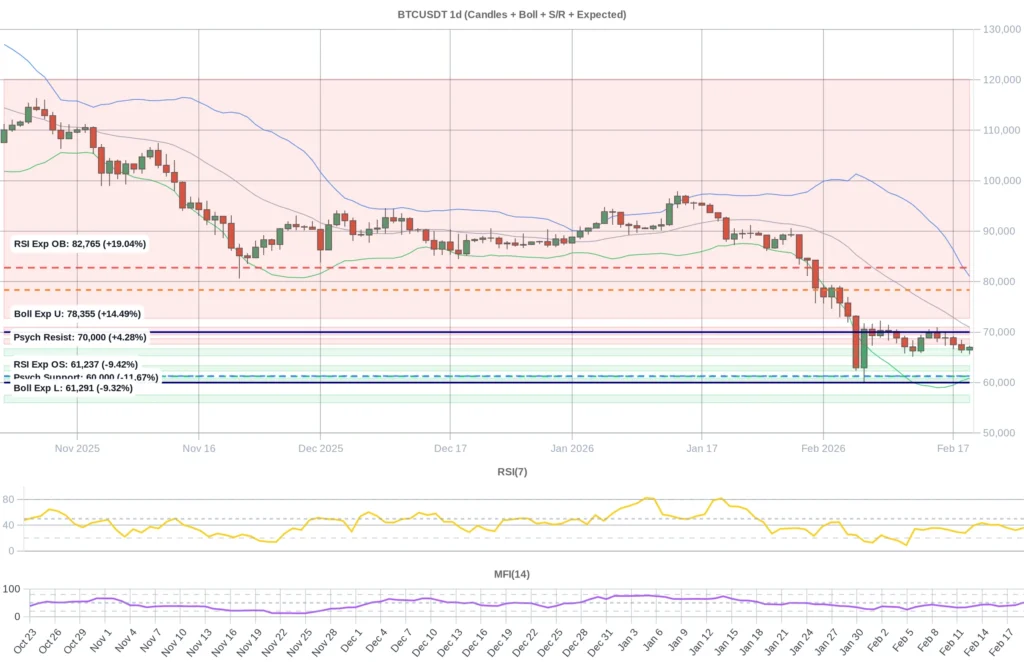
The prevailing long-term trend clearly indicates an expansion downtrend that has persisted over the past year, pointing toward a sustained bearish phase. Over the last 365 days, Bitcoin’s price has fallen by approximately 31%, with similar downward momentum evident in the 90- and 30-day timeframes. The Hull Moving Averages (HMA), especially the negative slopes of the 100- and 200-day moving averages, reinforce the presence of market pressure in both the long and medium term. Although the 50-day HMA has closed above the price, its declining slope suggests only a weak upward movement in the medium term.
In the short term, Bitcoin also appears fragile. The 7-day Relative Strength Index (RSI) hovers near 36, trending downward, while the Money Flow Index (MFI) sits around 51, reflecting a moderate but weak market sentiment. The price is near the lower Bollinger Band, indicating proximity to potential support levels, although no clear reversal has emerged yet. Intraday charts (4-hour and 1-hour) show slightly improved RSI slope, hinting at some short-term stabilization, though the market remains outside overbought or oversold conditions.
From a sentiment perspective, the funding rate remains negative, signaling ongoing selling pressure. However, open interest has increased by 1.4%, suggesting that market interest persists. The Fear and Greed Index is close to extreme fear (between 8 and 12), which can be interpreted as a potential buying opportunity in the short term, particularly for larger investors. Recent news over the past five days has generally supported bearish sentiments, influenced by global economic uncertainties and concerns related to U.S. political policies.
Key support is identified between 65,300 and 66,600 USD; a break below this range could open the door to further declines toward 62,300 to 63,300 USD. On the upside, resistance lies around 67,600 to 68,700 USD, a zone whose breach might provide some relief to the market. According to Bollinger Bands, the lower band is near 60,880 USD, close to the RSI’s oversold level around 61,237 USD, while the current price near 67,000 USD sits approximately 9% above these thresholds. This suggests a moderate chance of a short-term rebound, though bearish pressure dominates both long and medium-term outlooks.
Overall, Bitcoin’s market remains under stress, with limited prospects for price stabilization or meaningful recovery. Investors should closely monitor support and resistance levels and avoid making decisions driven by emotion. While some short-term technical indicators show tentative positivity, the overarching long-term downtrend cannot be overlooked, making a cautious approach the most prudent strategy.
Data Summary
- 1. Time:
2026-02-20 – 00:00 UTC - 2. Prices:
Open: 66461.00000000High: 67320.00000000Low: 65631.83000000Close: 67003.73000000
- 8. Supports:
S1: 66698.33000000 – 65302.67000000S2: 63339.99000000 – 62302.00000000S3: 60864.99000000 – 60459.90000000S4: 57541.1 – 56018
- 9. Resistances:
R1: 67620.01000000 – 68693.26000000R2: 69436.43000000 – 70983.00000000R3: 72736.42000000 – 120134.08000000
- 10. Psychological Support:
60000.00000000
- 11. Psychological Resistance:
70000.00000000
- 3. Last 5 days’ closing prices:
2026-02-15: 68832.580000002026-02-16: 68892.430000002026-02-17: 67503.520000002026-02-18: 66461.000000002026-02-19: 67003.73000000
- 4. Volume:
BTC: 14542.2699USD: $968863572.7822
- 5. Number of trades:
4679351
- 6. Indicators:
RSI: 36.0400MFI: 51.4000BB Upper: 81066.49000000BB Lower: 60881.93000000
- 7. Moving Averages:
SMA:7=68195.7400000014=68564.5800000021=70974.2100000030=76217.2000000050=82688.73000000100=86271.83000000200=99563.39000000EMA:
7=67832.9800000014=69656.4100000021=71991.2300000030=74708.0700000050=79160.86000000100=86270.28000000200=92922.76000000HMA:
7=66216.8000000014=67615.8700000021=66805.7500000030=64390.7500000050=63978.17000000100=74355.93000000200=75962.12000000 - 12. Funding Rate:
-0.0031% (Technically Positive)
- 13. Open Interest:
80180.3600
- 14. Fear & Greed Index:
9 (Extreme Fear)
Disclaimer: This market analysis is generated by AI based on historical BTC data and sentiment indicators. Use it as a reference, not financial advice.
