

Market Analysis
The current state of the Bitcoin market presents a complex scenario. Despite ongoing long-term downward pressure, there are some encouraging signals and short-term reactions reflected in technical indicators. Investors are advised to adopt a cautious approach, carefully considering multiple time frames and a variety of technical metrics before making decisions.
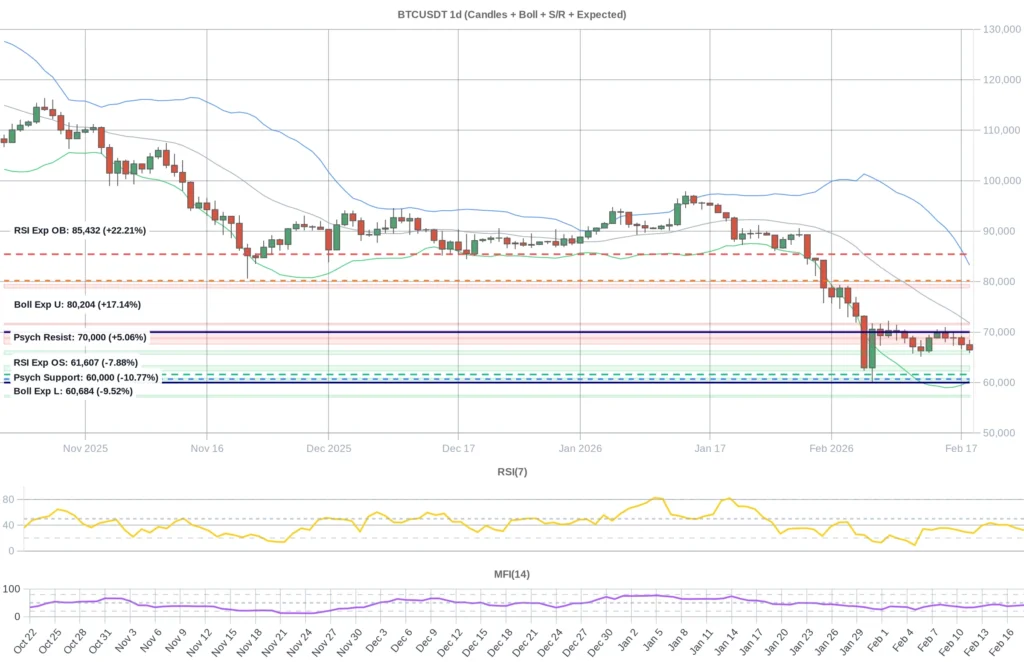
Analyzing the market trends reveals a clear long-term bearish momentum, as indicated by the 365-day and 90-day exponential downtrend patterns. Over the past few months, Bitcoin’s price has declined by approximately 30%, underscoring the prevailing bearish sentiment. The Hull Moving Average (HMA) further confirms this outlook, with the 50-, 100-, and 200-day moving averages all trending downward, signaling a strong and sustained downtrend. Notably, the 50-day HMA continues to decline below the current price, reflecting persistent bearish control in the medium term as well.
On the short-term front, the Relative Strength Index (RSI) and Money Flow Index (MFI) readings are below 30, indicating weakness in the market. However, these indicators have not yet entered the oversold territory (below 20), suggesting that there is no extreme sell-off pressure at this point. Prices remain within the Bollinger Bands and hover close to the middle band, highlighting ongoing market uncertainty. Daily expected levels based on RSI and Bollinger Bands place the oversold price zone roughly between $60,683 and $61,606, which is below the current price of $66,412. This suggests that while the market is nearing oversold conditions, it has not fully entered that zone, leaving room for a moderate short-term rebound.
Intraday indicators on the 1-hour and 4-hour charts show RSI readings near 34 with a downward bias, signaling continued short-term pressure. Similarly, the positioning of Bollinger Bands near the lower price range points to a potential support area. Support levels appear solid between $65,596 and $66,274; a breach of this range could lead to further declines toward the next significant support zone between $62,302 and $63,339. Resistance is expected between $67,620 and $68,693, where price advances may face substantial resistance.
Market sentiment remains dominated by fear, with the Fear and Greed Index fluctuating between 8 and 12—levels indicative of extreme apprehension. Historically, such environments often create buying opportunities for large investors, especially when prices approach oversold thresholds. The funding rate remains positive but low, suggesting a somewhat balanced market dynamic, while open interest has risen by 4.4%, reflecting growing market engagement. Recent news over the past five days has generally supported bearish trends, particularly due to global financial policies and economic strategies enacted by former U.S. President Donald Trump, which have contributed to heightened market uncertainty.
Overall, Bitcoin is navigating a challenging phase marked by persistent long-term bearish momentum, tempered by short-term technical signs and support levels that hint at a possible stabilization. Investors should monitor multiple time frames and technical indicators closely and avoid making emotionally driven decisions. If prices hold steady at key support zones, a short-term rebound is plausible; however, the dominant long-term downtrend remains intact, warranting a cautious and measured approach.
Data Summary
- 1. Time:
2026-02-19 – 00:00 UTC - 2. Prices:
Open: 67503.52000000High: 68476.22000000Low: 65870.00000000Close: 66461.00000000
- 8. Supports:
S1: 66274.01000000 – 65596.29000000S2: 63339.99000000 – 62302.00000000S3: 60864.99000000 – 60459.90000000S4: 57487.7 – 57128
- 9. Resistances:
R1: 67620.01000000 – 68693.26000000R2: 68892.43000000 – 70288.00000000R3: 71446.62000000 – 71758.00000000R4: 78738.6 – 79424
- 10. Psychological Support:
60000.00000000
- 11. Psychological Resistance:
70000.00000000
- 3. Last 5 days’ closing prices:
2026-02-14: 69822.950000002026-02-15: 68832.580000002026-02-16: 68892.430000002026-02-17: 67503.520000002026-02-18: 66461.00000000
- 4. Volume:
BTC: 15492.4384USD: $1040493524.6521
- 5. Number of trades:
4548997
- 6. Indicators:
RSI: 32.2700MFI: 41.7300BB Upper: 83288.49000000BB Lower: 60340.55000000
- 7. Moving Averages:
SMA:7=68091.2300000014=68272.1600000021=71814.5200000030=76931.3300000050=83101.62000000100=86632.38000000200=99818.69000000EMA:
7=68109.4000000014=70064.5100000021=72489.9800000030=75239.4100000050=79657.07000000100=86659.50000000200=93183.26000000HMA:
7=66951.9700000014=68019.3600000021=66808.5700000030=64229.0200000050=64650.36000000100=75254.63000000200=76432.40000000 - 12. Funding Rate:
0.0036% (Technically Positive)
- 13. Open Interest:
79067.5610
- 14. Fear & Greed Index:
8 (Extreme Fear)
Disclaimer: This market analysis is generated by AI based on historical BTC data and sentiment indicators. Use it as a reference, not financial advice.
