
Market Analysis
Bitcoin’s current market shows signs of tentative stabilization; however, the overall trend remains under pressure. Investors need to carefully evaluate a combination of technical indicators and market sentiment to make informed decisions moving forward.
A long-term perspective clearly highlights an extended downtrend for Bitcoin, supported by data from the past 365 days which reveals an approximate 28% decline in price. Mid-term data spanning 90 and 30 days further confirm this bearish momentum, with significant price drops and prevailing bearish sentiment. The 50-period Hull Moving Average (HMA50) remains above the current price but is sloping downward, indicating a weak upward trend at best. Additionally, the MACD histogram shows conflicting signals—a generally negative average with intermittent positive readings—reflecting uncertainty in the medium term.
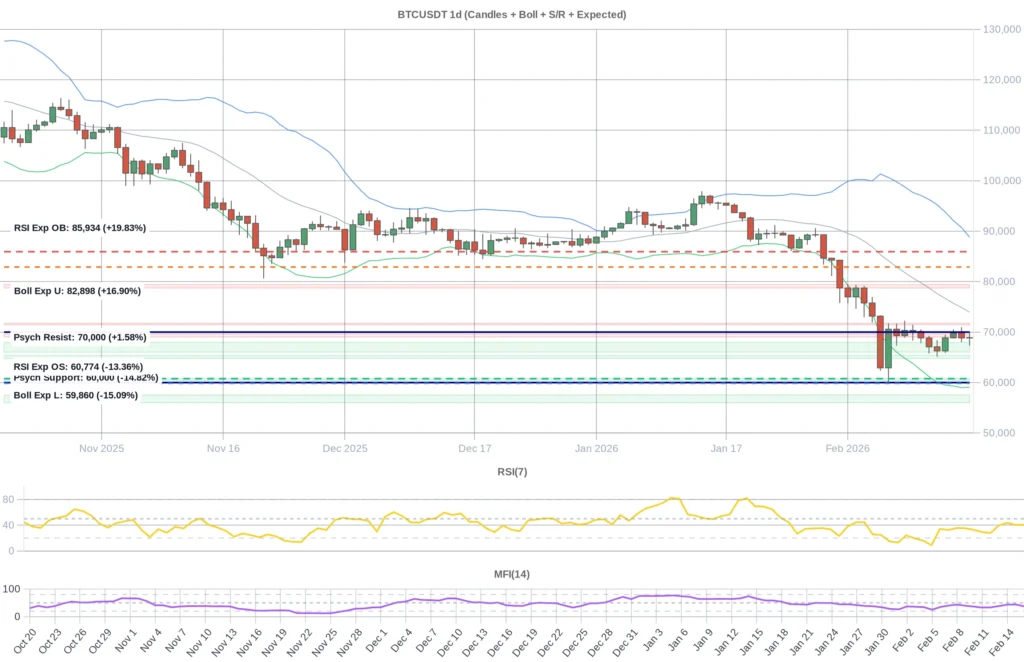
In the short term, the 7-day Relative Strength Index (RSI7) hovers around 40, suggesting neither significant weakness nor strong buying pressure, but rather a neutral stance. The 14-day Money Flow Index (MFI14) near 37 points to moderate liquidity and trading volume. Prices staying within the Bollinger Bands and centered in the middle band indicate no decisive breakout has occurred recently. Importantly, the support range between approximately 66,034 and 67,969 serves as a critical safety net; a breach below this zone could lead to increased selling pressure, with the next support level near 64,800.
Intraday timeframes, such as the 1-hour and 4-hour charts, also show RSI7 levels between 39 and 40, albeit with a positive slope, hinting at slight short-term improvement. However, Bollinger Bands remain centered, suggesting relative price stability but a low probability of a sharp breakout. A negative funding rate points toward a tilt in favor of short positions, while a mild decline in open interest reflects cautious market participation. The Fear and Greed Index is currently low at 12, indicating a fearful market environment, though not at extremes, which some investors may interpret as a potential buying opportunity.
Reviewing recent news and market sentiment over the last five days reveals no major developments influencing a decisive price movement. This implies that price action is currently driven predominantly by technical and emotional factors. Despite the long-term bearish trend, there are early signs of modest improvement and stabilization in the medium and short terms, possibly signaling a reversal or at least temporary respite. Nonetheless, the persistent downward slope of longer-term HMAs such as the 100 and 200-period averages cannot be overlooked.
According to today’s expected daily levels, the oversold price zone based on RSI and Bollinger Bands lies roughly between 59,860 and 60,773, while the overbought zone ranges from about 82,898 to 85,933. With the current price around 67,578—approximately 11% above the oversold threshold—the market’s momentum can be considered moderate. Should support levels hold firm, some price recovery may be anticipated; conversely, a breakdown could intensify downward pressure.
Overall, Bitcoin’s market continues to face long-term bearish pressure, yet there are emerging signs of stabilization and minor gains in the mid and short term. Investors are advised to closely monitor key support and resistance levels and factor in both emotional sentiment and technical indicators when crafting their strategies. Given the prevailing long-term downtrend alongside the possibility of a short-term reversal, a cautious and measured approach is prudent at this stage.
Data Summary
- 1. Time:
2026-02-18 – 00:00 UTC - 2. Prices:
Open: 68832.59000000High: 70126.67000000Low: 67294.11000000Close: 68892.43000000
- 8. Supports:
S1: 67969.65000000 – 66034.50000000S2: 65376.00000000 – 64800.01000000S3: 60864.99000000 – 60459.90000000S4: 57541.1 – 56018
- 9. Resistances:
R1: 69031.99000000 – 69610.00000000R2: 71446.62000000 – 71758.00000000R3: 78738.6 – 79424
- 10. Psychological Support:
60000.00000000
- 11. Psychological Resistance:
70000.00000000
- 3. Last 5 days’ closing prices:
2026-02-12: 66272.170000002026-02-13: 68853.960000002026-02-14: 69822.950000002026-02-15: 68832.580000002026-02-16: 68892.43000000
- 4. Volume:
BTC: 15515.7653USD: $1062797918.2536
- 5. Number of trades:
5233849
- 6. Indicators:
RSI: 40.7300MFI: 37.4800BB Upper: 88795.73000000BB Lower: 59079.54000000
- 7. Moving Averages:
SMA:7=68371.1300000014=69341.5600000021=73937.6400000030=78675.9900000050=83936.79000000100=87400.08000000200=100335.54000000EMA:
7=69043.9800000014=71098.1900000021=73651.8200000030=76420.0800000050=80713.73000000100=87462.79000000200=93712.61000000HMA:
7=69547.7900000014=68245.4000000021=66237.6700000030=63946.1800000050=66238.68000000100=77072.37000000200=77390.03000000 - 12. Funding Rate:
-0.0041% (Technically Positive)
- 13. Open Interest:
77130.0180
- 14. Fear & Greed Index:
12 (Extreme Fear)
Disclaimer: This market analysis is generated by AI based on historical BTC data and sentiment indicators. Use it as a reference, not financial advice.
