
Market Analysis
The market is showing slight signs of improvement today; however, the overall trend remains uncertain and fragile. Complexities in the global economy have dampened investor confidence, making it difficult to establish a clear direction for Bitcoin’s price movement.
Over the past five days, Bitcoin has experienced significant volatility, indicating that market equilibrium has yet to be achieved. On February 8, the price opened at 69,289 and climbed to a peak of 72,271 but then gradually showed signs of weakness, falling to 66,272 by February 12. The 7-day Relative Strength Index (RSI) has steadily dropped below 35, reaching 27.85, signaling a weakening market. Similarly, the 14-day Money Flow Index (MFI) declined from 43.53 to 33.59, suggesting reduced capital inflow. While neither indicator indicates that the market has yet entered oversold territory, both reflect mounting pressure and fragility.
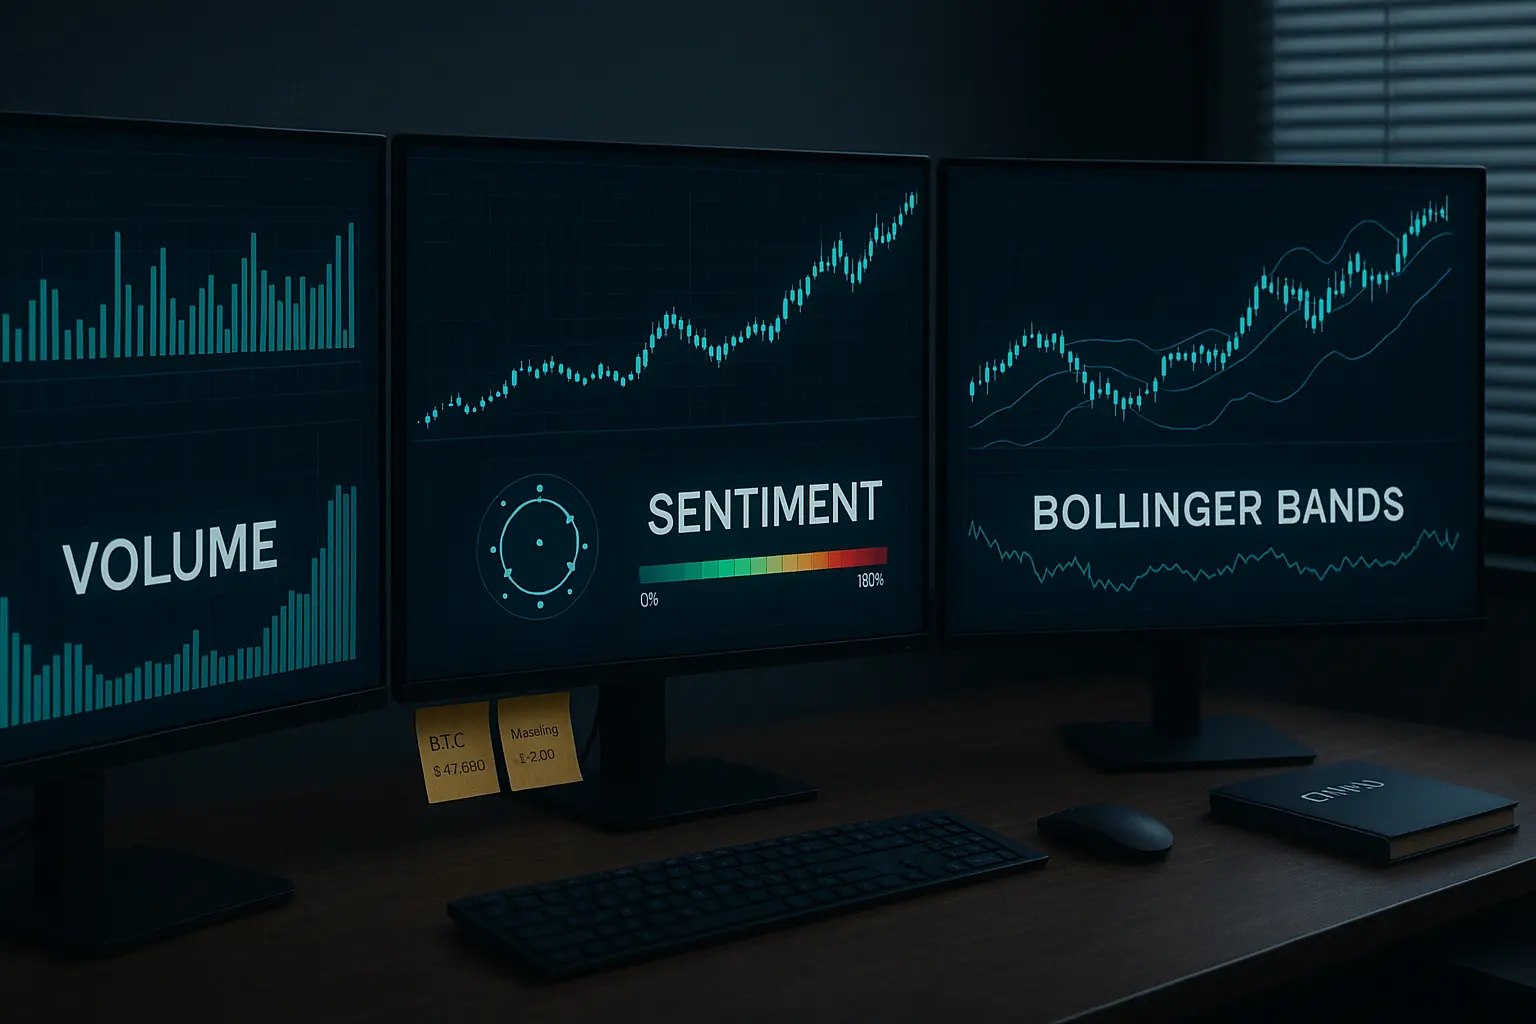
Looking at the Bollinger Bands, the price currently hovers near the midline, around 77,625, while also approaching the lower band. This suggests reduced volatility but persistent downward pressure. The Fear and Greed Index is currently near extreme fear levels—between 5 and 14—which could present short-term buying opportunities. However, ongoing global economic uncertainties mean investors remain cautious and hesitant to enter the market decisively. Trading volumes have also fluctuated, dropping from 29,152 on February 9 to 24,271 on February 12, signaling a decline in trading activity.
An analysis of Hull Moving Averages (HMA) reveals the 7-day HMA at 66,303, close to the current price, but the 14-day and 21-day HMAs stand at 66,722 and 64,464 respectively. The consistent decline in the 7-day HMA points to short-term weakness. In contrast, the 50, 100, and 200-day HMAs remain significantly higher, representing strong long-term resistance levels. Support zones range from S1 to S3, between 63,178 and 60,459, offering key protective levels should the price decline further. Resistance levels lie between R1 and R3, from approximately 67,620 to 71,997, which act as barriers to upward movement. A close above R1 could open the door to advances toward R2 and R3; otherwise, the trend may continue downward toward support.
Recent news over the last five days has focused on the slowdown in the global economy and political uncertainties, keeping investors cautious. Tensions in trade relations, particularly between the U.S. and China, have further impacted market sentiment. Financing rates remain negative, encouraging short positions, while open interest has increased by 2.2%, indicating sustained market engagement despite prevailing fears.
In summary, Bitcoin's price is at a delicate juncture. Despite some short-term gains, the overall market sentiment leans from neutral toward bearish. Both global economic factors and technical indicators signal that investors should exercise caution, as further market corrections remain a possibility before any significant move occurs. Breaking below support levels could lead to further declines, and given the strong resistance overhead, an immediate rebound appears unlikely. Therefore, adopting a cautious stance and awaiting clearer market signals would be prudent under the current conditions.
Data Summary
- 1. Time:
2026-02-13 – 00:00 UTC - 2. Prices:
Open: 67082.52000000High: 68410.52000000Low: 65118.00000000Close: 66272.17000000
- 8. Supports:
S1: 64143.56000000 – 63178.32000000S2: 63152.01000000 – 62670.00000000S3: 60864.99000000 – 60459.90000000S4: 54018.8 – 49000
- 9. Resistances:
R1: 67620.01000000 – 68693.26000000R2: 69031.99000000 – 69610.00000000R3: 71108.00000000 – 71997.02000000R4: 78738.6 – 79424
- 10. Psychological Support:
60000.00000000
- 11. Psychological Resistance:
70000.00000000
- 3. Last 5 days’ closing prices:
2026-02-08: 70330.380000002026-02-09: 70138.000000002026-02-10: 68841.290000002026-02-11: 67082.520000002026-02-12: 66272.17000000
- 4. Volume:
BTC: 24271.7428USD: $1622162145.3342
- 5. Number of trades:
6778280
- 6. Indicators:
RSI: 27.8500MFI: 33.5900BB Upper: 95234.42000000BB Lower: 60016.20000000
- 7. Moving Averages:
SMA:7=68933.4300000014=72363.4500000021=77625.3100000030=82237.7700000050=85417.24000000100=88744.89000000200=101326.86000000EMA:
7=69006.1400000014=72655.1800000021=75769.3800000030=78660.3100000050=82729.84000000100=88992.37000000200=94717.10000000HMA:
7=66303.2000000014=66722.7000000021=64464.8000000030=65281.2500000050=70804.99000000100=80894.74000000200=79372.22000000 - 12. Funding Rate:
-0.0017% (Technically Positive)
- 13. Open Interest:
80997.5190
- 14. Fear & Greed Index:
5 (Extreme Fear)
Disclaimer: This market analysis is generated by AI based on historical BTC data and sentiment indicators. Use it as a reference, not financial advice.
