
Market Analysis
The current market analysis reveals some signs of mild improvement; however, the overall trend remains cautious with a bearish inclination. The complexities surrounding the global economy have significantly influenced investor sentiment, and this impact is clearly reflected in the cryptocurrency market.
Over the past five days, Bitcoin's price has experienced notable fluctuations, resulting in mixed market sentiment. On January 24th, the price opened near 89,600 and closed slightly lower at 89,225. The following day saw a sharp decline, with the price dropping to 86,670. The high trading volume and increased number of transactions during this period indicate strong selling pressure. The Relative Strength Index (RSI) fell to a weak level of 23.29, while the Money Flow Index (MFI) hovered around 44.51, signaling reduced liquidity and weak buying interest. The Fear and Greed Index remained steady at 25, reflecting a prevailing state of fear among investors.
From January 26th onward, there were tentative signs of recovery. The price rose to approximately 88,347, and the RSI increased to 37.78, indicating a fragile yet growing strength. Price movements stayed within the Bollinger Bands, closing near the middle band after bouncing off the lower band—a potential signal of stabilization. Short-term moving averages for 7 and 14 days showed slight gains, suggesting improvement in the short-term trend, though the 21, 30, and 50-day moving averages continue to present strong resistance above the current price levels.
On January 27th and 28th, marginal price gains were observed, with values fluctuating between 89,250 and 89,299. Both RSI and MFI remained stable around 44, reflecting neutral market sentiment. The Fear and Greed Index saw a modest improvement, but fear still dominated investor psychology. Despite some volatility in trading volume, there was an uptick in significant trading activity, indicating that investors are engaging with the market cautiously.
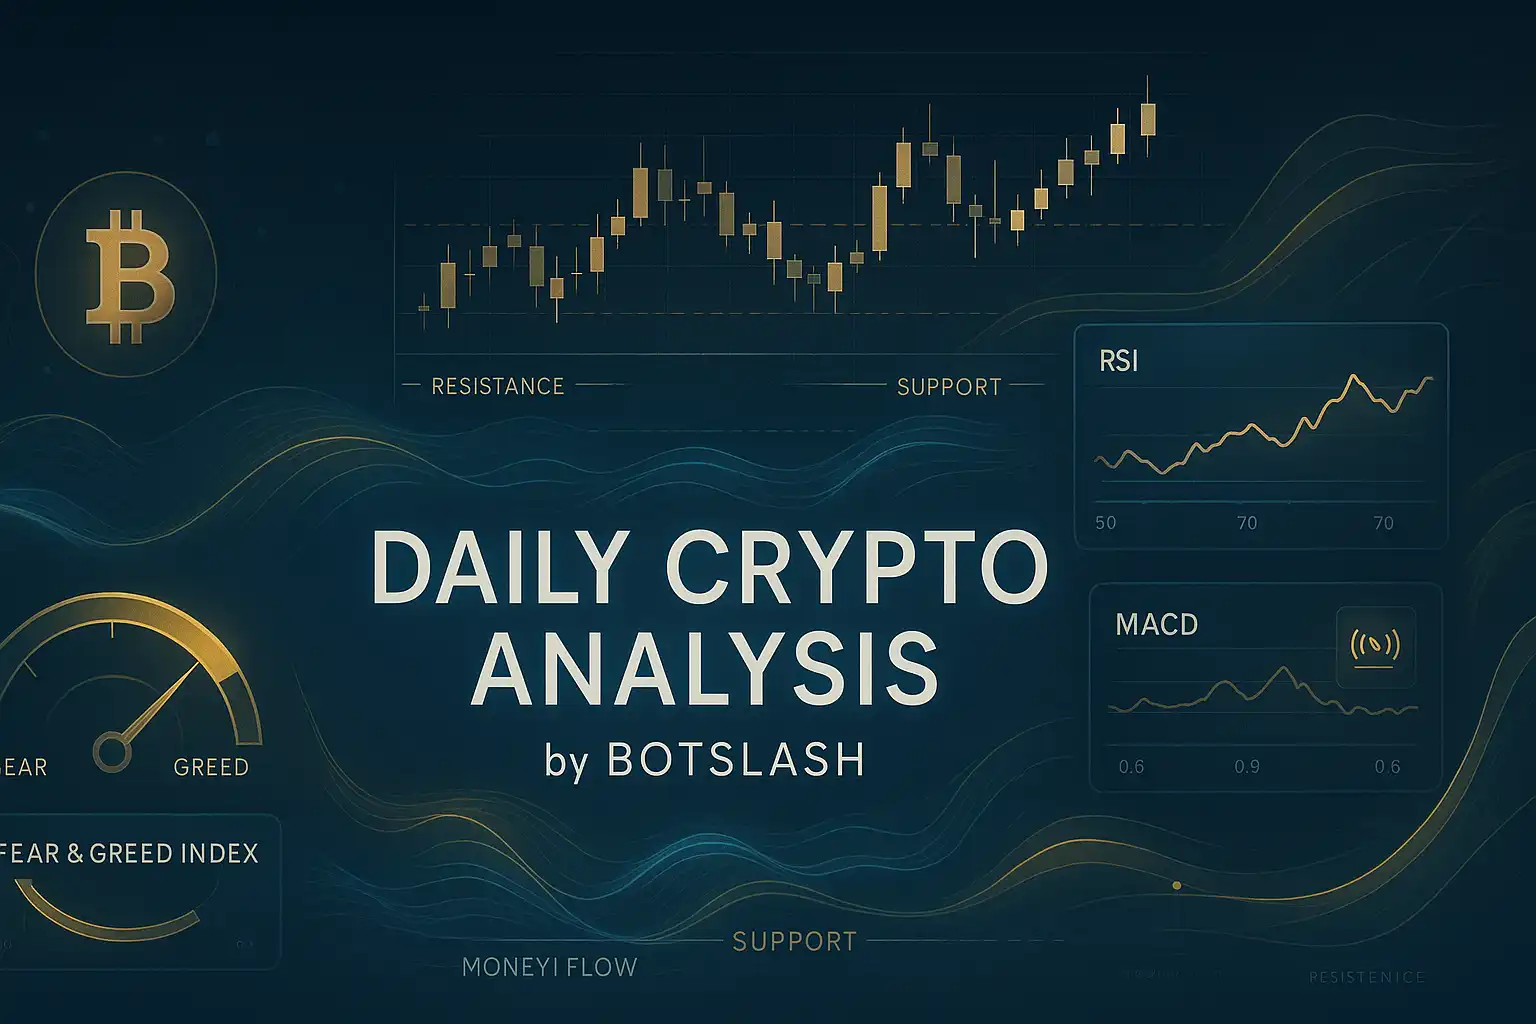
The MACD indicators are sending mixed signals, with the market lacking a clear directional trend due to its proximity to the signal line. While short-term moving averages have provided some support for the price, long-term moving averages remain substantially above current levels, suggesting that downward pressure has not yet eased.
In terms of support, the S1 range between 87,952 and 84,667 offers solid backing, with S2 and S3 levels providing additional protection between 84,474 and 80,818. Should the price fall below S1, these lower support zones will become critical. Psychological support remains firmly anchored at the 80,000 mark, representing a key defensive threshold for the market. On the resistance side, levels from R1 through R4 span between 90,375 and 104,550, indicating significant hurdles for upward momentum. The psychological resistance at 90,000 has been tested multiple times in recent days, underscoring the difficulty in surpassing this level.
Examining global developments, ongoing economic uncertainties—particularly tensions in U.S.-China trade relations and concerns surrounding the European financial landscape—have contributed to investor caution. Regulatory anxieties within the crypto sector and shifts in central banks’ monetary policies further influence market sentiment. These factors increase the likelihood of short-term volatility, while sustained long-term stability will require more positive signals.
Overall, Bitcoin’s current position reflects a market leaning from neutral toward bearish, with some encouraging signs but insufficient momentum for a full recovery. Investors are advised to closely monitor support and resistance levels and adopt a cautious approach in light of the sensitive global economic environment. Short-term price swings are expected to continue, while long-term stability will depend on improvements in the global economy and more favorable news flow.
Data Summary
- 1. Time:
2026-01-29 – 00:00 UTC - 2. Prices:
Open: 89249.99000000High: 90600.00000000Low: 88833.65000000Close: 89299.99000000
- 8. Supports:
S1: 87952.01000000 – 84667.03000000S2: 84474.69000000 – 83949.52000000S3: 82715.03000000 – 80818.84000000S4: 76322.4 – 76239.9
- 9. Resistances:
R1: 90375.20000000 – 93673.14000000R2: 93859.71000000 – 95228.45000000R3: 96551.01000000 – 97463.95000000R4: 103262 – 104550
- 10. Psychological Support:
80000.00000000
- 11. Psychological Resistance:
90000.00000000
- 3. Last 5 days’ closing prices:
2026-01-24: 89225.340000002026-01-25: 86670.360000002026-01-26: 88347.080000002026-01-27: 89250.000000002026-01-28: 89299.99000000
- 4. Volume:
BTC: 14332.1850USD: $1283919840.8515
- 5. Number of trades:
4385791
- 6. Indicators:
RSI: 44.7700MFI: 38.5600BB Upper: 97070.24000000BB Lower: 85726.37000000
- 7. Moving Averages:
SMA:7=88850.3900000014=90888.7700000021=91398.3000000030=91182.0600000050=90026.42000000100=94235.82000000200=104559.58000000EMA:
7=89231.2500000014=90044.4600000021=90398.0400000030=90591.7200000050=91321.81000000100=94684.36000000200=98239.58000000HMA:
7=89114.8500000014=87603.8300000021=87259.7300000030=89323.5100000050=91946.74000000100=89958.12000000200=84069.61000000 - 12. Funding Rate:
0.0038% (Technically Positive)
- 13. Open Interest:
101896.1270
- 14. Fear & Greed Index:
29 (Fear)
Disclaimer: This market analysis is generated by AI based on historical BTC data and sentiment indicators. Use it as a reference, not financial advice.
