
Market Analysis
The market is showing some positive signs today, but overall, the environment remains cautious with a bearish leaning. Ongoing global economic uncertainties and the inherent volatility in the crypto market are prompting investors to adopt a more guarded approach.
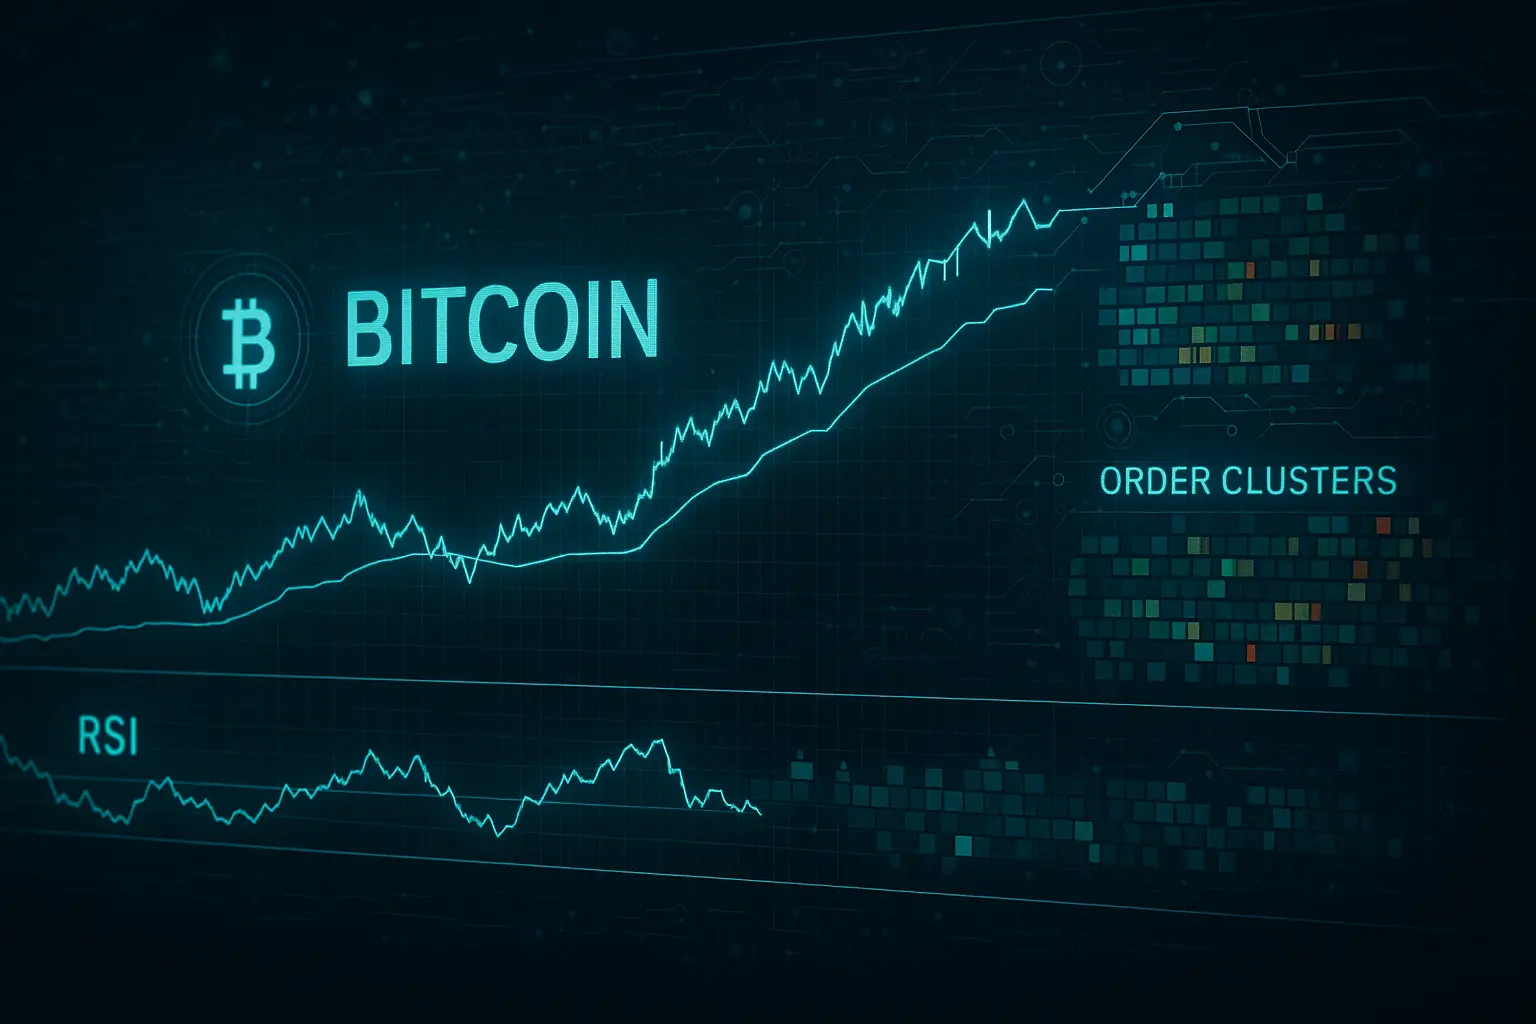
Bitcoin’s price has fluctuated within a narrow range over the past five days. On January 21, it opened at 88,427 and closed slightly higher at 89,454. Following this, the price saw a modest increase but then sharply dropped to a low of 86,074 on January 25, signaling clear downward pressure. The Relative Strength Index (RSI) stayed consistently below 50, dipping as low as 23.29 on January 25, indicating weakening market momentum. Similarly, the Money Flow Index (MFI) hovered between 43 and 49, reflecting a decline in cash flow within the market. The Fear & Greed Index remained low, between 20 and 25, highlighting prevailing investor apprehension and lack of confidence.
Looking at the Bollinger Bands, the price approached the lower band on January 25, which typically suggests an oversold or undervalued condition. However, the bands did not widen significantly, indicating that volatility remains subdued and the market is experiencing a phase of sluggishness rather than sharp moves. Moving averages further confirm this trend: short-term Hull Moving Averages (7 and 14 days) are trending slightly downward, as are the longer-term ones (21, 30, and 50 days), all pointing to sustained bearish pressure. The current closing price of 86,670 is below the 7-day HMA of 87,852, reinforcing short-term weakness.
In terms of support, the primary zone (S1) lies between 84,739 and 83,111, close to the recent lows, and serves as a strong defense level. Should this support break, the next critical range (S2) is between 82,715 and 80,818, which could potentially halt further decline. Resistance levels are positioned at R1 (87,232–88,175), just above the recent close, and are expected to pose a challenge for upward movement. Beyond that, R2 (90,375–93,673) represents a significant long-term resistance barrier. The psychological threshold of 90,000 should also be noted, as it often influences market sentiment.
From a sentiment perspective, the funding rate is slightly positive at 0.000049, and open interest has increased by 1.31%, indicating some renewed market participation. Nevertheless, the low Fear & Greed Index and prevailing economic uncertainties suggest that investors remain cautious rather than aggressively buying. Recent global economic pressures and political instability continue to weigh on the crypto market, potentially impacting long-term investment outlooks negatively.
The MACD indicator remains neutral, showing no decisive crossover, which aligns with the prevailing market indecision. Trading volumes have fluctuated, with a notable spike on January 21, followed by a gradual decline, signaling weakening buying and selling activity. Overall, while there is modest short-term momentum, a cautious stance is advisable for medium to long-term investors. Close attention to support and resistance levels, along with ongoing developments in the global economy, is essential to navigate potential sudden market shifts.
In summary, Bitcoin currently trades within an uncertain range between 86,000 and 90,000, with both technical and sentiment indicators suggesting bearish pressure. Though slight price improvements may occur in the coming days, investors should remain vigilant due to ongoing economic challenges and subdued market signals. Failure to hold support levels could lead to further declines, while resistance levels may continue to cap upward moves. Given these conditions, any buying or selling decisions should be made thoughtfully and with caution.
Data Summary
- 1. Time:
2026-01-26 – 00:00 UTC - 2. Prices:
Open: 89225.34000000High: 89319.13000000Low: 86074.72000000Close: 86670.36000000
- 8. Supports:
S1: 84739.74000000 – 83111.64000000S2: 82715.03000000 – 80818.84000000S3: 78595.86000000 – 76322.42000000
- 9. Resistances:
R1: 87232.01000000 – 88175.98000000R2: 90375.20000000 – 93673.14000000R3: 96551.01000000 – 97463.95000000R4: 101110 – 101732
- 10. Psychological Support:
80000.00000000
- 11. Psychological Resistance:
90000.00000000
- 3. Last 5 days’ closing prices:
2026-01-21: 89454.730000002026-01-22: 89559.670000002026-01-23: 89600.260000002026-01-24: 89225.340000002026-01-25: 86670.36000000
- 4. Volume:
BTC: 14426.2202USD: $1264233689.8416
- 5. Number of trades:
3720178
- 6. Indicators:
RSI: 23.2900MFI: 44.5100BB Upper: 97410.49000000BB Lower: 86536.09000000
- 7. Moving Averages:
SMA:7=89367.0000000014=92086.2600000021=91973.2900000030=91054.3900000050=90162.65000000100=94830.45000000200=104852.02000000EMA:
7=89476.9000000014=90599.1100000021=90862.2900000030=90947.2300000050=91620.64000000100=95037.60000000200=98521.92000000HMA:
7=87852.5100000014=87503.7200000021=89145.2900000030=91503.8300000050=93155.93000000100=89874.63000000200=84287.65000000 - 12. Funding Rate:
0.0049%
- 13. Open Interest:
99585.4610
- 14. Fear & Greed Index:
25 (Extreme Fear)
Disclaimer: This market analysis is generated by AI based on historical BTC data and sentiment indicators. Use it as a reference, not financial advice.
