
Market Analysis
The market is showing slight signs of improvement today; however, the overall trend remains uncertain with a bearish inclination. Investors are exercising caution due to ongoing challenges in the global economy and the complex dynamics within the cryptocurrency sector.
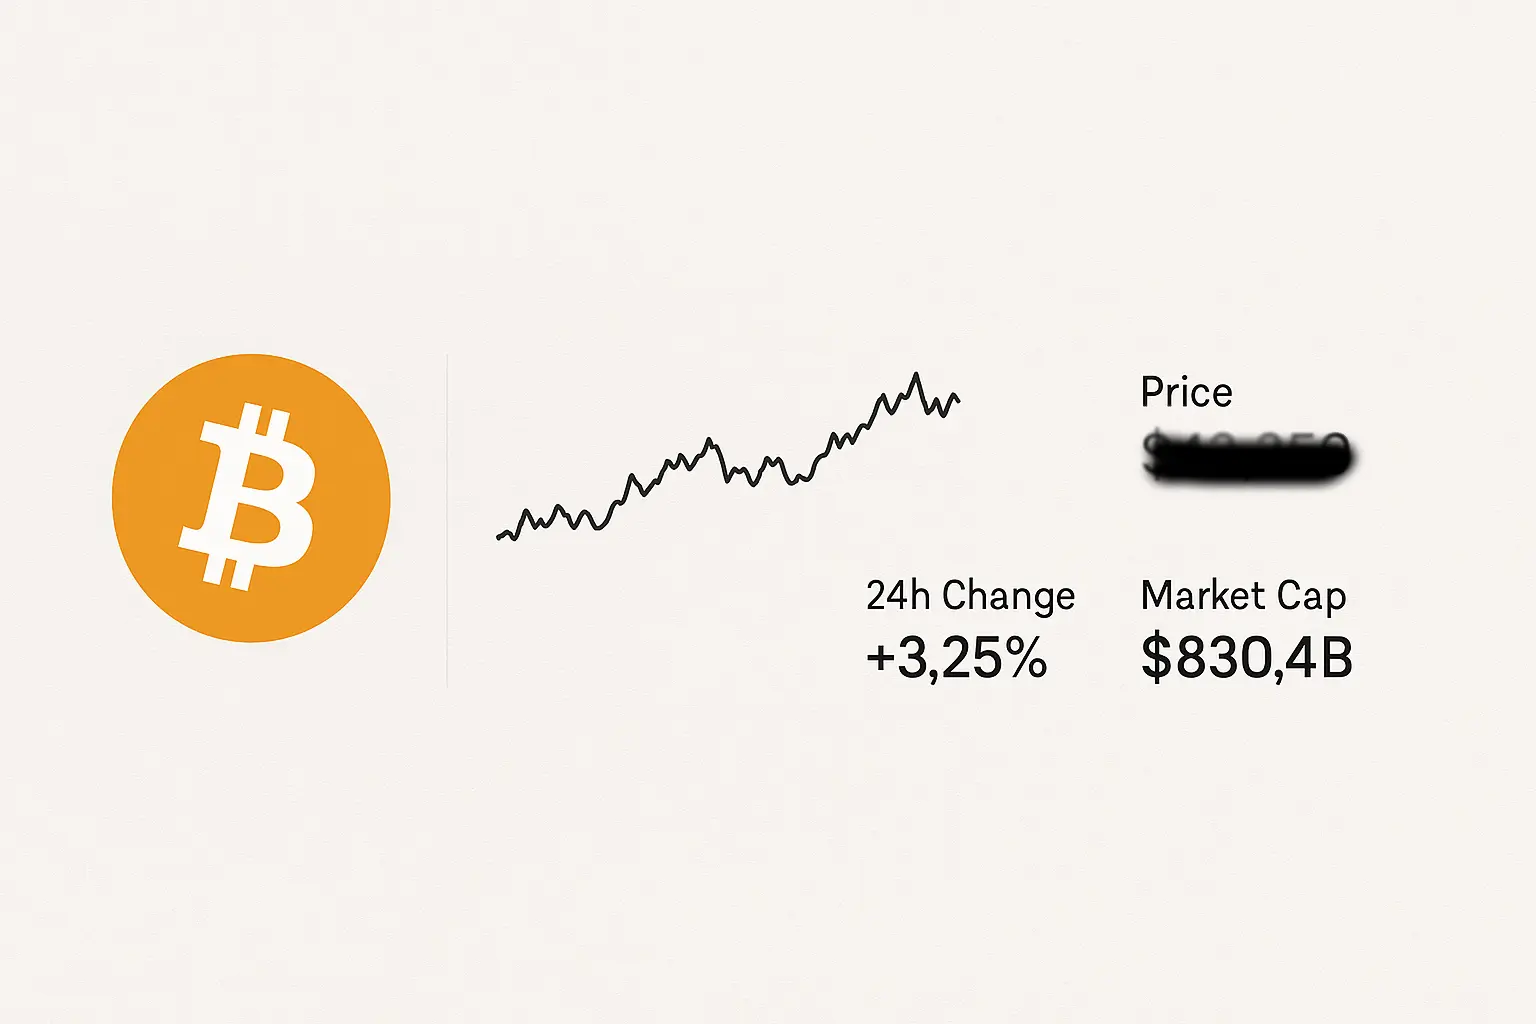
Bitcoin's price has been trading within a narrow range over the past five days, reflecting the prevailing market uncertainty. On January 20th, a sharp decline was observed as the price dropped from an opening of 92,630 to close at 88,427. The Relative Strength Index (RSI) at 7 days stood at 26.8, indicating weak buying momentum. Meanwhile, the Money Flow Index (MFI) at 14 days was around 44.6, pointing to moderate liquidity and average market volume. Although prices showed a modest recovery in the following days, both RSI and MFI remained below 50, suggesting that selling pressure persists and buyers have yet to gain significant control. The price's confinement within the Bollinger Bands, coupled with declining volume, further emphasizes market hesitation and the absence of a clear directional move.
Looking at moving averages, the 7-day Hull Moving Average (HMA) recently dipped below the current price level, signaling a weakening uptrend. Similarly, the 14, 21, and 30-day moving averages are sloping downward, indicating medium- to long-term selling pressure. Notably, the 50- and 100-day moving averages remain well above the current price, confirming a bearish trend. However, the 200-day moving average, positioned near 84,351, could serve as a strong support level if prices decline further.
In terms of support, the first range (S1) lies between 87,952 and 84,667, close to current price levels. A break below this could lead to the next support zone (S2) between 84,474 and 83,949. Additional support levels (S3 and S4) are available further down to cushion potential drops. On the upside, resistance zones are identified at R1 (90,375–93,673), R2 (93,859–95,228), and R3 (96,551–97,463), which could act as barriers to upward movement. Psychological levels at 90,000 (resistance) and 80,000 (support) remain critical, especially amid ongoing market uncertainty.
The Fear and Greed Index has fluctuated between 20 and 32 over the last five days, reflecting a prevailing sense of fear—though not extreme panic. This environment may present short-term buying opportunities, but a cautious approach is advised for longer-term positions. Declining open interest and low trading volumes, combined with near-zero funding rates, suggest that large investors remain uncertain. Additionally, negative news stemming from sluggish global economic growth and geopolitical tensions, particularly financial strains in the U.S. and Europe, continue to weigh on the crypto market sentiment.
The MACD indicator has not produced a decisive crossover, further confirming the unclear market direction. RSI and MFI figures reinforce ongoing downward pressure, although there are signs that prices are attempting to stabilize in recent days. The narrowing of Bollinger Bands points to reduced volatility, often a precursor to a significant price movement. Given these factors, investors are advised to avoid impulsive decisions and wait for a clearer trend to develop.
Overall, Bitcoin is at a delicate juncture. While there are some encouraging signals, the general trend remains somewhere between neutral and bearish. Considering the global economic uncertainties and technical indicators, investors should manage their positions prudently and monitor key support and resistance levels closely. A modest price recovery could occur in the short term, but downward pressure is likely to persist over a longer horizon.
Data Summary
- 1. Time:
2026-01-25 – 00:00 UTC - 2. Prices:
Open: 89600.26000000High: 89957.39000000Low: 89162.08000000Close: 89225.34000000
- 8. Supports:
S1: 87952.01000000 – 84667.03000000S2: 84474.69000000 – 83949.52000000S3: 82715.03000000 – 80818.84000000S4: 76322.4 – 76239.9
- 9. Resistances:
R1: 90375.20000000 – 93673.14000000R2: 93859.71000000 – 95228.45000000R3: 96551.01000000 – 97463.95000000R4: 103262 – 104550
- 10. Psychological Support:
80000.00000000
- 11. Psychological Resistance:
90000.00000000
- 3. Last 5 days’ closing prices:
2026-01-20: 88427.660000002026-01-21: 89454.730000002026-01-22: 89559.670000002026-01-23: 89600.260000002026-01-24: 89225.34000000
- 4. Volume:
BTC: 4226.5674USD: $378464146.0919
- 5. Number of trades:
959854
- 6. Indicators:
RSI: 33.4700MFI: 49.0800BB Upper: 97106.74000000BB Lower: 87302.64000000
- 7. Moving Averages:
SMA:7=90367.4000000014=92396.5000000021=92204.6900000030=91077.6900000050=90213.97000000100=95028.06000000200=104966.59000000EMA:
7=90412.4100000014=91203.5300000021=91281.4800000030=91242.1800000050=91822.69000000100=95206.63000000200=98641.03000000HMA:
7=89035.8900000014=88372.0400000021=90326.1400000030=92320.5900000050=93532.36000000100=89804.80000000200=84351.72000000 - 12. Funding Rate:
0.0039% (Technically Positive)
- 13. Open Interest:
98288.6210
- 14. Fear & Greed Index:
25 (Extreme Fear)
Disclaimer: This market analysis is generated by AI based on historical BTC data and sentiment indicators. Use it as a reference, not financial advice.
