
Market Analysis
Signs of a mild recovery are emerging in the market today, yet the overall trend remains uncertain and fragile. The complexities of the global economy have unsettled the investment landscape, making it difficult to establish a clear direction for cryptocurrency prices.
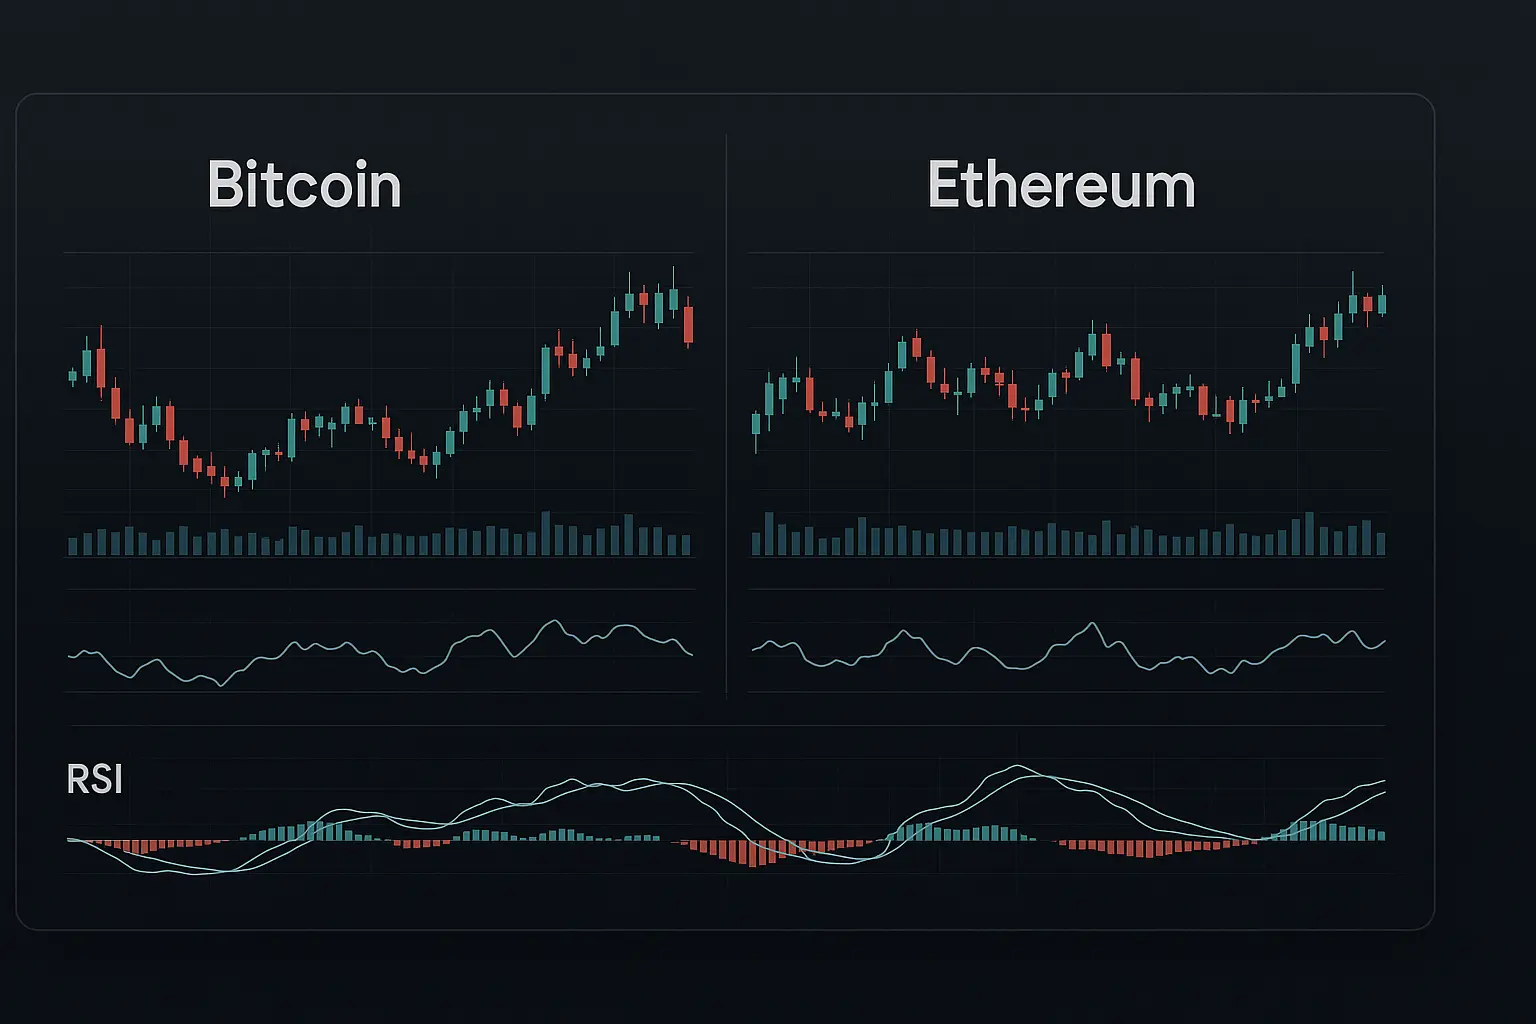
Over the past five days, Bitcoin has experienced notable volatility, starting near 91,000 and briefly approaching 97,000. On January 12, the price opened at 91,013 and closed slightly higher at 91,296, with the RSI at 56.8 and the MFI at 63.7, indicating moderate strength. The following day, January 13, saw a sharp upward move, closing at 95,414. During this surge, the RSI rose to 78.2 and the MFI to 65.87, nearing overbought levels and suggesting the possibility of a short-term pullback. Trading volume and activity also increased on this day, reflecting temporary buyer strength.
On January 14 and 15, Bitcoin’s price fluctuated between 96,951 and 95,604. The RSI declined from 82.07 to 69.47, while the MFI dropped from 73.7 to 65.16, signaling a partial reversal from overbought territory and a reduction in momentum. From a Bollinger Bands perspective, the price approached the upper band on January 14—an area that acted as resistance—before stabilizing near the middle band. By January 16, Bitcoin closed near 95,550 with an RSI of 68.98 and MFI of 58.72, suggesting moderate but weakening bullish momentum.
Analysis of moving averages shows the 7-day Hull Moving Average (HMA) declining to around 97,125 on January 16, compared to previous days, while the 14-day and 21-day HMAs maintain a steady upward trend. This pattern indicates some softening in short-term bullishness, but the medium- and long-term outlook remains positive. Support levels span from 94,881 down to 92,206 and 92,015, all close to the current price and likely to serve as key floors should the market dip. Resistance lies between 96,551 and 97,463, near recent highs; surpassing this range could open the way to the next resistance around 101,109.
The Fear and Greed Index has fluctuated between 27 and 61 during the past five days, reflecting prevailing caution and investor apprehension. Fear subsided somewhat on January 13 and 14 but returned to 49 shortly after, underscoring ongoing market uncertainty. Financing rates and open interest have seen modest increases, indicating some renewed interest, though not strong enough to confirm a sustained trend.
Macro factors continue to weigh on the crypto market as well. Weakness in the global economy and political uncertainties—especially the trade tensions between the U.S. and China and Europe’s economic slowdown—have made investors more cautious. Potential interest rate hikes by central banks add further pressure on the investment climate. Together, these elements contribute to a precarious environment where both bullish and bearish scenarios remain plausible.
In summary, Bitcoin is currently exhibiting a cautious and somewhat indecisive pattern. While short-term signals show some positive momentum, declining volume, subdued financing rates, and global economic headwinds are restraining a full bullish breakout. The presence of clearly defined support and resistance levels is keeping the price within a range, suggesting that it is prudent to await a clearer directional signal. Investors are advised to monitor both global developments and technical indicators carefully, avoiding impulsive decisions, as sudden shifts in either direction remain possible under current conditions.
Data Summary
- 1. Time:
2026-01-17 – 00:00 UTC - 2. Prices:
Open: 95604.81000000High: 95871.47000000Low: 94293.46000000Close: 95550.94000000
- 8. Supports:
S1: 94881.47000000 – 92206.02000000S2: 92015.37000000 – 91203.67000000S3: 87952.01000000 – 84667.03000000S4: 82574.5 – 81644.8
- 9. Resistances:
R1: 96551.01000000 – 97463.95000000R2: 101109.59000000 – 101732.31000000R3: 103261.60000000 – 104550.33000000R4: 108816 – 109450
- 10. Psychological Support:
90000.00000000
- 11. Psychological Resistance:
100000.00000000
- 3. Last 5 days’ closing prices:
2026-01-12: 91296.200000002026-01-13: 95414.000000002026-01-14: 96951.780000002026-01-15: 95604.800000002026-01-16: 95550.94000000
- 4. Volume:
BTC: 11167.7146USD: $1064019408.0773
- 5. Number of trades:
2971559
- 6. Indicators:
RSI: 68.9800MFI: 58.7200BB Upper: 96956.68000000BB Lower: 85637.76000000
- 7. Moving Averages:
SMA:7=93762.3000000014=92800.4900000021=91297.2200000030=90209.5300000050=90148.68000000100=96822.78000000200=105621.33000000EMA:
7=94330.3200000014=92926.8900000021=92091.5900000030=91634.9900000050=92210.71000000100=95957.65000000200=99283.98000000HMA:
7=97125.7600000014=95566.0900000021=94722.5500000030=94367.5000000050=92360.45000000100=87464.16000000200=84676.95000000 - 12. Funding Rate:
0.0025% (Technically Positive)
- 13. Open Interest:
96594.6730
- 14. Fear & Greed Index:
49 (Neutral)
Disclaimer: This market analysis is generated by AI based on historical BTC data and sentiment indicators. Use it as a reference, not financial advice.
